SCB Prospectus - Announcements - Bursa Malaysia
SCB Prospectus - Announcements - Bursa Malaysia
SCB Prospectus - Announcements - Bursa Malaysia

Create successful ePaper yourself
Turn your PDF publications into a flip-book with our unique Google optimized e-Paper software.
Company No. 462648-V<br />
2. INFORMATION SUMMARY (CONT'D)<br />
2.3 FINANCIAL HIGHLIGHTS<br />
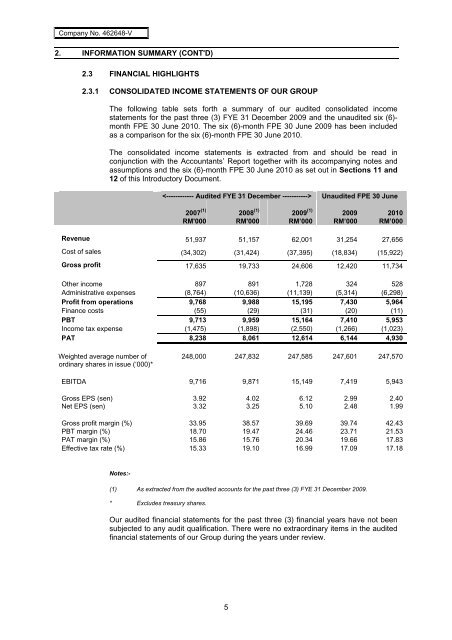
2.3.1 CONSOLIDATED INCOME STATEMENTS OF OUR GROUP<br />
The following table sets forth a summary of our audited consolidated income<br />
statements for the past three (3) FYE 31 December 2009 and the unaudited six (6)month<br />
FPE 30 June 2010. The six (6)-month FPE 30 June 2009 has been included<br />
as a comparison for the six (6)-month FPE 30 June 2010.<br />
The consolidated income statements is extracted from and should be read in<br />
conjunction with the Accountants’ Report together with its accompanying notes and<br />
assumptions and the six (6)-month FPE 30 June 2010 as set out in Sections 11 and<br />
12 of this Introductory Document.<br />
Unaudited FPE 30 June<br />
2007 (1)<br />
RM'000<br />
5<br />
2008 (1)<br />
RM'000<br />
2009 (1)<br />
RM’000<br />
2009<br />
RM’000<br />
2010<br />
RM’000<br />
Revenue 51,937 51,157 62,001 31,254 27,656<br />
Cost of sales (34,302) (31,424) (37,395) (18,834) (15,922)<br />
Gross profit 17,635 19,733 24,606 12,420 11,734<br />
Other income 897 891 1,728 324 528<br />
Administrative expenses (8,764) (10,636) (11,139) (5,314) (6,298)<br />
Profit from operations 9,768 9,988 15,195 7,430 5,964<br />
Finance costs (55) (29) (31) (20) (11)<br />
PBT 9,713 9,959 15,164 7,410 5,953<br />
Income tax expense (1,475) (1,898) (2,550) (1,266) (1,023)<br />
PAT 8,238 8,061 12,614 6,144 4,930<br />
Weighted average number of<br />
ordinary shares in issue (‘000)*<br />
248,000 247,832 247,585 247,601 247,570<br />
EBITDA 9,716 9,871 15,149 7,419 5,943<br />
Gross EPS (sen) 3.92 4.02 6.12 2.99 2.40<br />
Net EPS (sen) 3.32 3.25 5.10 2.48 1.99<br />
Gross profit margin (%) 33.95 38.57 39.69 39.74 42.43<br />
PBT margin (%) 18.70 19.47 24.46 23.71 21.53<br />
PAT margin (%) 15.86 15.76 20.34 19.66 17.83<br />
Effective tax rate (%) 15.33 19.10 16.99 17.09 17.18<br />
Notes:-<br />
(1) As extracted from the audited accounts for the past three (3) FYE 31 December 2009.<br />
* Excludes treasury shares.<br />
Our audited financial statements for the past three (3) financial years have not been<br />
subjected to any audit qualification. There were no extraordinary items in the audited<br />
financial statements of our Group during the years under review.