Introduction to regression
Introduction to regression
Introduction to regression

You also want an ePaper? Increase the reach of your titles
YUMPU automatically turns print PDFs into web optimized ePapers that Google loves.
Chapter 3 <strong>Introduction</strong> <strong>to</strong> <strong>regression</strong> 121<br />
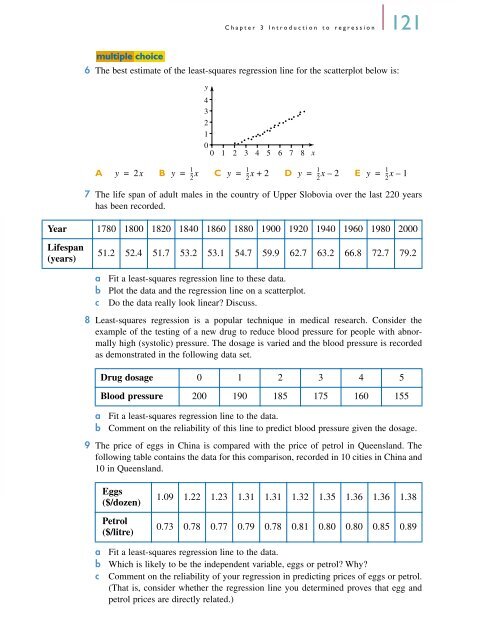
6 The best estimate of the least-squares <strong>regression</strong> line for the scatterplot below is:<br />
7 The life span of adult males in the country of Upper Slobovia over the last 220 years<br />
has been recorded.<br />
Year 1780 1800 1820 1840 1860 1880 1900 1920 1940 1960 1980 2000<br />
Lifespan<br />
(years)<br />
multiple ultiple choice<br />
51.2 52.4 51.7 53.2 53.1 54.7 59.9 62.7 63.2 66.8 72.7 79.2<br />
a Fit a least-squares <strong>regression</strong> line <strong>to</strong> these data.<br />
b Plot the data and the <strong>regression</strong> line on a scatterplot.<br />
c Do the data really look linear? Discuss.<br />
8 Least-squares <strong>regression</strong> is a popular technique in medical research. Consider the<br />
example of the testing of a new drug <strong>to</strong> reduce blood pressure for people with abnormally<br />
high (sys<strong>to</strong>lic) pressure. The dosage is varied and the blood pressure is recorded<br />
as demonstrated in the following data set.<br />
Drug dosage 0 1 2 3 4 5<br />
Blood pressure 200 190 185 175 160 155<br />
a Fit a least-squares <strong>regression</strong> line <strong>to</strong> the data.<br />
b Comment on the reliability of this line <strong>to</strong> predict blood pressure given the dosage.<br />
9 The price of eggs in China is compared with the price of petrol in Queensland. The<br />
following table contains the data for this comparison, recorded in 10 cities in China and<br />
10 in Queensland.<br />
Eggs<br />
($/dozen)<br />
Petrol<br />
($/litre)<br />
y<br />
4<br />
3<br />
2<br />
1<br />
0<br />
0 1 2 3 4 5 6 7 8 x<br />
1<br />
1<br />
1<br />
1<br />
A y = 2x B y = --x C y = --x + 2 D y = --x – 2 E y =<br />
--x – 1<br />
2<br />
2<br />
2<br />
2<br />
1.09 1.22 1.23 1.31 1.31 1.32 1.35 1.36 1.36 1.38<br />
0.73 0.78 0.77 0.79 0.78 0.81 0.80 0.80 0.85 0.89<br />
a Fit a least-squares <strong>regression</strong> line <strong>to</strong> the data.<br />
b Which is likely <strong>to</strong> be the independent variable, eggs or petrol? Why?<br />
c Comment on the reliability of your <strong>regression</strong> in predicting prices of eggs or petrol.<br />
(That is, consider whether the <strong>regression</strong> line you determined proves that egg and<br />
petrol prices are directly related.)