Introduction to regression
Introduction to regression
Introduction to regression

Create successful ePaper yourself
Turn your PDF publications into a flip-book with our unique Google optimized e-Paper software.
Residual analysis<br />
y<br />
Chapter 3 <strong>Introduction</strong> <strong>to</strong> <strong>regression</strong> 129<br />
There are situations where the mere fitting of a <strong>regression</strong> line <strong>to</strong> some data is not<br />
enough <strong>to</strong> convince us that the data set is truly linear. Even if the correlation is close <strong>to</strong><br />
+1 or −1 it still may not be convincing enough.<br />
The next stage is <strong>to</strong> analyse the residuals, or deviations, of each data point from the<br />
straight line. These are nothing more than the ‘error’ bars of the figure in worked<br />
example 2.<br />
A residual is the vertical difference between each data point and the <strong>regression</strong> line.<br />
Calculating residuals<br />
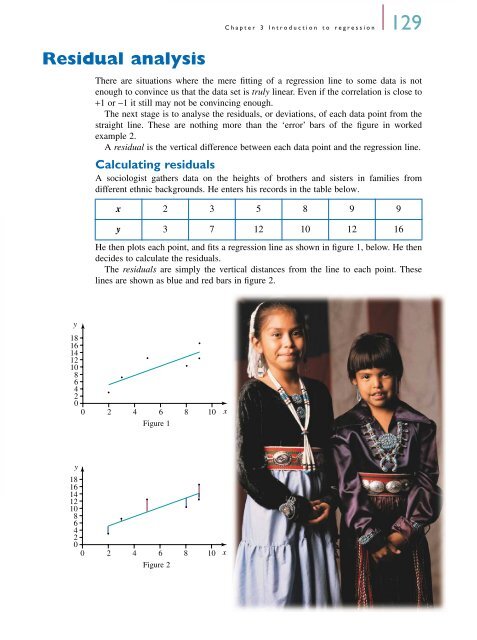
A sociologist gathers data on the heights of brothers and sisters in families from<br />
different ethnic backgrounds. He enters his records in the table below.<br />
x 2 3 5 8 9 9<br />
y 3 7 12 10 12 16<br />
He then plots each point, and fits a <strong>regression</strong> line as shown in figure 1, below. He then<br />
decides <strong>to</strong> calculate the residuals.<br />
The residuals are simply the vertical distances from the line <strong>to</strong> each point. These<br />
lines are shown as blue and red bars in figure 2.<br />
18<br />
16<br />
14<br />
12<br />
10<br />
8<br />
6<br />
4<br />
2<br />
0<br />
0 2 4 6 8 10<br />
Figure 1<br />
y<br />
18<br />
16<br />
14<br />
12<br />
10<br />
8<br />
6<br />
4<br />
2<br />
0<br />
0 2 4 6 8 10 x<br />
Figure 2<br />
x