Introduction to regression
Introduction to regression
Introduction to regression

You also want an ePaper? Increase the reach of your titles
YUMPU automatically turns print PDFs into web optimized ePapers that Google loves.
summary<br />
Chapter 3 <strong>Introduction</strong> <strong>to</strong> <strong>regression</strong> 139<br />
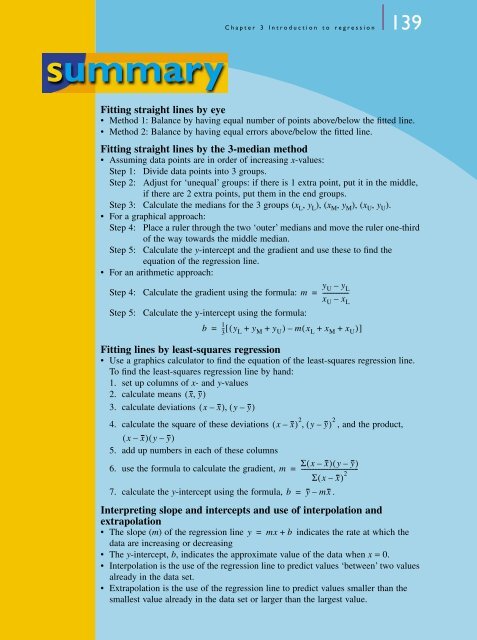
Fitting straight lines by eye<br />
• Method 1: Balance by having equal number of points above/below the fitted line.<br />
• Method 2: Balance by having equal errors above/below the fitted line.<br />
Fitting straight lines by the 3-median method<br />
• Assuming data points are in order of increasing x-values:<br />
Step 1: Divide data points in<strong>to</strong> 3 groups.<br />
Step 2: Adjust for ‘unequal’ groups: if there is 1 extra point, put it in the middle,<br />
if there are 2 extra points, put them in the end groups.<br />
Step 3: Calculate the medians for the 3 groups (xL, yL), (xM, yM), (xU, yU). • For a graphical approach:<br />
Step 4: Place a ruler through the two ‘outer’ medians and move the ruler one-third<br />
of the way <strong>to</strong>wards the middle median.<br />
Step 5: Calculate the y-intercept and the gradient and use these <strong>to</strong> find the<br />
equation of the <strong>regression</strong> line.<br />
• For an arithmetic approach:<br />
Step 4: Calculate the gradient using the formula: m =<br />
yU – yL ----------------xU<br />
– xL Step 5: Calculate the y-intercept using the formula:<br />
b =<br />
1<br />
-- [ ( y 3 L + yM + yU) – mx ( L + xM + xU) ]<br />
Fitting lines by least-squares <strong>regression</strong><br />
• Use a graphics calcula<strong>to</strong>r <strong>to</strong> find the equation of the least-squares <strong>regression</strong> line.<br />
To find the least-squares <strong>regression</strong> line by hand:<br />
1. set up columns of x- and y-values<br />
2. calculate means ( x, y)<br />
3. calculate deviations ( x – x)<br />
, ( y– y)<br />
4. calculate the square of these deviations ( x – x)<br />
, and the product,<br />
5. add up numbers in each of these columns<br />
6. use the formula <strong>to</strong> calculate the gradient,<br />
7. calculate the y-intercept using the formula, .<br />
2<br />
( y– y)<br />
2<br />
,<br />
( x – x)<br />
( y– y)<br />
m<br />
Σ( x – x)<br />
( y– y)<br />
Σ( x – x)<br />
2<br />
= -----------------------------------b<br />
= y– mx<br />
Interpreting slope and intercepts and use of interpolation and<br />
extrapolation<br />
• The slope (m) of the <strong>regression</strong> line y =<br />
mx + b indicates the rate at which the<br />
data are increasing or decreasing<br />
• The y-intercept, b, indicates the approximate value of the data when x = 0.<br />
• Interpolation is the use of the <strong>regression</strong> line <strong>to</strong> predict values ‘between’ two values<br />
already in the data set.<br />
• Extrapolation is the use of the <strong>regression</strong> line <strong>to</strong> predict values smaller than the<br />
smallest value already in the data set or larger than the largest value.