Introduction to regression
Introduction to regression
Introduction to regression

Create successful ePaper yourself
Turn your PDF publications into a flip-book with our unique Google optimized e-Paper software.
124 Further Mathematics<br />
THINK WRITE/DISPLAY<br />
1<br />
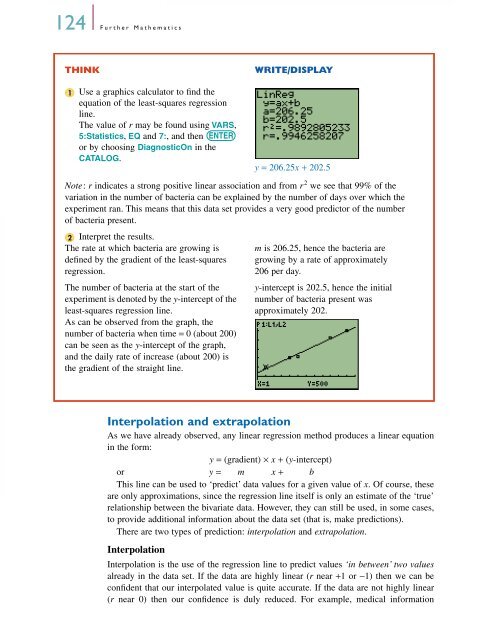
Use a graphics calcula<strong>to</strong>r <strong>to</strong> find the<br />
equation of the least-squares <strong>regression</strong><br />
line.<br />
The value of r may be found using VARS,<br />
5:Statistics, EQ and 7:, and then<br />
or by choosing DiagnosticOn in the<br />
CATALOG.<br />
Interpolation and extrapolation<br />
As we have already observed, any linear <strong>regression</strong> method produces a linear equation<br />
in the form:<br />
y = (gradient) × x + (y-intercept)<br />
or y = m x + b<br />
This line can be used <strong>to</strong> ‘predict’ data values for a given value of x. Of course, these<br />
are only approximations, since the <strong>regression</strong> line itself is only an estimate of the ‘true’<br />
relationship between the bivariate data. However, they can still be used, in some cases,<br />
<strong>to</strong> provide additional information about the data set (that is, make predictions).<br />
There are two types of prediction: interpolation and extrapolation.<br />
Interpolation<br />
ENTER<br />
y = 206.25x + 202.5<br />
Note: r indicates a strong positive linear association and from r 2 we see that 99% of the<br />
variation in the number of bacteria can be explained by the number of days over which the<br />
experiment ran. This means that this data set provides a very good predic<strong>to</strong>r of the number<br />
of bacteria present.<br />
2<br />
Interpret the results.<br />
The rate at which bacteria are growing is<br />
defined by the gradient of the least-squares<br />
<strong>regression</strong>.<br />
The number of bacteria at the start of the<br />
experiment is denoted by the y-intercept of the<br />
least-squares <strong>regression</strong> line.<br />
As can be observed from the graph, the<br />
number of bacteria when time = 0 (about 200)<br />
can be seen as the y-intercept of the graph,<br />
and the daily rate of increase (about 200) is<br />
the gradient of the straight line.<br />
m is 206.25, hence the bacteria are<br />
growing by a rate of approximately<br />
206 per day.<br />
y-intercept is 202.5, hence the initial<br />
number of bacteria present was<br />
approximately 202.<br />
Interpolation is the use of the <strong>regression</strong> line <strong>to</strong> predict values ‘in between’ two values<br />
already in the data set. If the data are highly linear (r near +1 or −1) then we can be<br />
confident that our interpolated value is quite accurate. If the data are not highly linear<br />
(r near 0) then our confidence is duly reduced. For example, medical information