Introduction to regression
Introduction to regression
Introduction to regression

You also want an ePaper? Increase the reach of your titles
YUMPU automatically turns print PDFs into web optimized ePapers that Google loves.
Chapter 3 <strong>Introduction</strong> <strong>to</strong> <strong>regression</strong> 125<br />
collected from a patient every third day would establish data for day 3, 6, 9, . . . and so<br />
on. After performing <strong>regression</strong> analysis, it is likely that an interpolation for day 4<br />
would be accurate (given good r values) and that there were actual data on that day.<br />
Extrapolation<br />
Extrapolation is the use of the <strong>regression</strong> line <strong>to</strong> predict values smaller than the<br />
smallest value already in the data set or larger than the largest value.<br />
Two problems may arise in attempting <strong>to</strong> extrapolate from a data set. Firstly, it may<br />
not be reasonable <strong>to</strong> extrapolate <strong>to</strong>o far away from the given data values. For example,<br />
suppose there is a weather data set for 5 days. Even if it is highly linear (r near +1 or −1)<br />
a <strong>regression</strong> line used <strong>to</strong> predict the same data 15 days in the future is highly risky.<br />
Weather has a habit of randomly fluctuating and patterns rarely stay stable for very<br />
long.<br />
Secondly, the data may be highly linear in a narrow band of the given data set. For<br />
example, there may be data on s<strong>to</strong>pping distances for a train at speeds of between 30<br />
and 60 km/h. Even if they are highly linear in this range, it is unlikely that things are<br />
similar at very low speeds (0–15 km/h) or high speeds (over 100 km/h).<br />
Generally therefore, one should feel more confident about the accuracy of a prediction<br />
derived from interpolation than one derived from extrapolation. Of course, it still<br />
depends upon the correlation coefficient (r). The closer <strong>to</strong> linearity the data are, the<br />
more confident our predictions in all cases.<br />
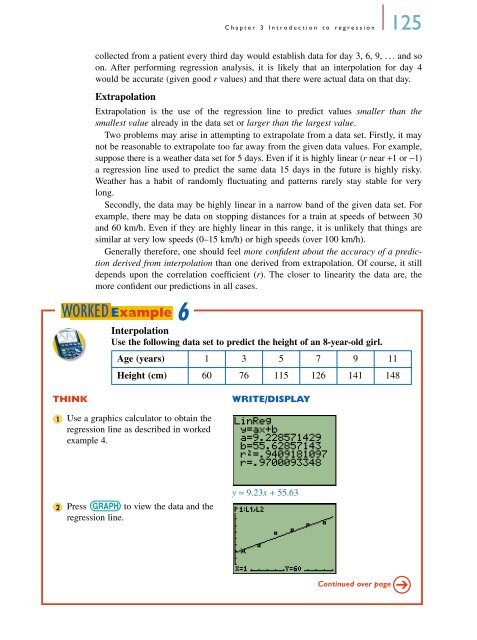
Interpolation<br />
Use the following data set <strong>to</strong> predict the height of an 8-year-old girl.<br />
Age (years) 1 3 5 7 9 11<br />
Height (cm) 60 76 115 126 141 148<br />
THINK WRITE/DISPLAY<br />
1<br />
2<br />
WORKED Example<br />
6<br />
Use a graphics calcula<strong>to</strong>r <strong>to</strong> obtain the<br />
<strong>regression</strong> line as described in worked<br />
example 4.<br />
Press GRAPH <strong>to</strong> view the data and the<br />
<strong>regression</strong> line.<br />
y = 9.23x + 55.63<br />
Continued over page