Introduction to regression
Introduction to regression
Introduction to regression

You also want an ePaper? Increase the reach of your titles
YUMPU automatically turns print PDFs into web optimized ePapers that Google loves.
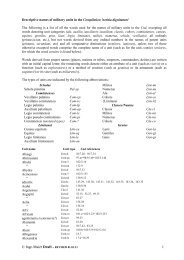
EXCEL Spreadsheet<br />
GC program<br />
Residuals<br />
BV stats<br />
WorkSHEET 3.2<br />
132 Further Mathematics<br />
WORKED<br />
Example<br />
8<br />
WORKED<br />
Example<br />
9<br />
3E<br />
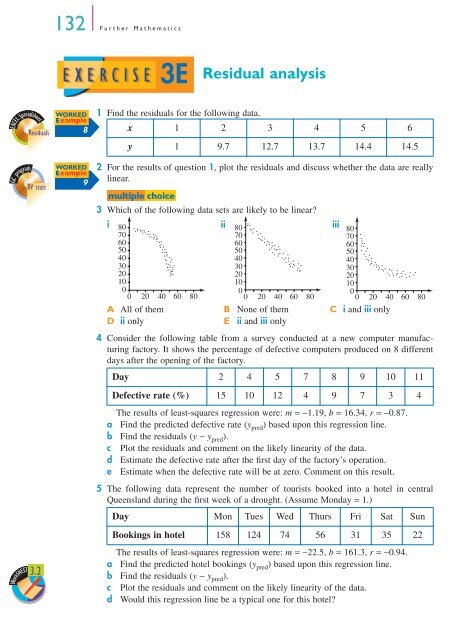
Residual analysis<br />
1 Find the residuals for the following data.<br />
x 1 2 3 4 5 6<br />
y 1 9.7 12.7 13.7 14.4 14.5<br />
2 For the results of question 1, plot the residuals and discuss whether the data are really<br />
linear.<br />
multiple ultiple choice<br />
3 Which of the following data sets are likely <strong>to</strong> be linear?<br />
i 80<br />
70<br />
60<br />
50<br />
40<br />
30<br />
20<br />
10<br />
0<br />
0 20 40 60 80<br />
ii 80<br />
70<br />
60<br />
50<br />
40<br />
30<br />
20<br />
10<br />
0<br />
0 20 40 60 80<br />
iii 80<br />
70<br />
60<br />
50<br />
40<br />
30<br />
20<br />
10<br />
0<br />
0 20 40 60 80<br />
A All of them B None of them C i and iii only<br />
D ii only E ii and iii only<br />
4 Consider the following table from a survey conducted at a new computer manufacturing<br />
fac<strong>to</strong>ry. It shows the percentage of defective computers produced on 8 different<br />
days after the opening of the fac<strong>to</strong>ry.<br />
Day 2 4 5 7 8 9 10 11<br />
Defective rate (%) 15 10 12 4 9 7 3 4<br />
The results of least-squares <strong>regression</strong> were: m = −1.19, b = 16.34, r = −0.87.<br />
a Find the predicted defective rate (y pred) based upon this <strong>regression</strong> line.<br />
b Find the residuals (y − y pred).<br />
c Plot the residuals and comment on the likely linearity of the data.<br />
d Estimate the defective rate after the first day of the fac<strong>to</strong>ry’s operation.<br />
e Estimate when the defective rate will be at zero. Comment on this result.<br />
5 The following data represent the number of <strong>to</strong>urists booked in<strong>to</strong> a hotel in central<br />
Queensland during the first week of a drought. (Assume Monday = 1.)<br />
Day Mon Tues Wed Thurs Fri Sat Sun<br />
Bookings in hotel 158 124 74 56 31 35 22<br />
The results of least-squares <strong>regression</strong> were: m = −22.5, b = 161.3, r = −0.94.<br />
a Find the predicted hotel bookings (y pred) based upon this <strong>regression</strong> line.<br />
b Find the residuals (y − y pred).<br />
c Plot the residuals and comment on the likely linearity of the data.<br />
d Would this <strong>regression</strong> line be a typical one for this hotel?