Introduction to regression
Introduction to regression
Introduction to regression

Create successful ePaper yourself
Turn your PDF publications into a flip-book with our unique Google optimized e-Paper software.
THINK WRITE/DISPLAY<br />
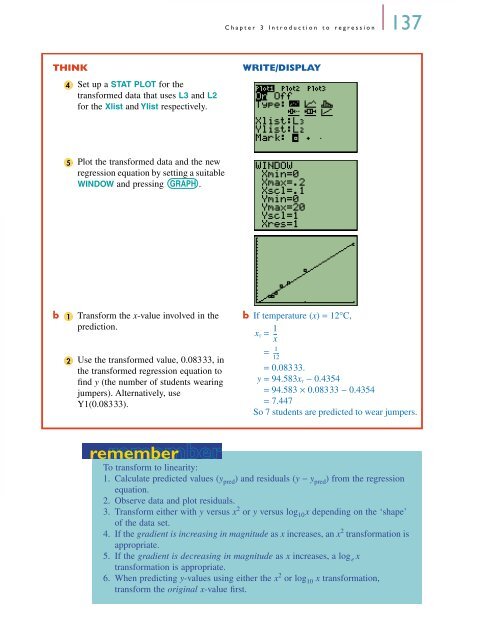
4 Set up a STAT PLOT for the<br />
transformed data that uses L3 and L2<br />
for the Xlist and Ylist respectively.<br />
5<br />
Plot the transformed data and the new<br />
<strong>regression</strong> equation by setting a suitable<br />
WINDOW and pressing GRAPH .<br />
b 1 Transform the x-value involved in the<br />
prediction.<br />
2<br />
Use the transformed value, 0.08333, in<br />
the transformed <strong>regression</strong> equation <strong>to</strong><br />
find y (the number of students wearing<br />
jumpers). Alternatively, use<br />
Y1(0.08333).<br />
remember<br />
remember<br />
Chapter 3 <strong>Introduction</strong> <strong>to</strong> <strong>regression</strong> 137<br />
b If temperature (x) = 12°C,<br />
1<br />
xT = --<br />
x<br />
1<br />
= -----<br />
12<br />
= 0.08333.<br />
y = 94.583xT − 0.4354<br />
= 94.583 × 0.08333 − 0.4354<br />
= 7.447<br />
So 7 students are predicted <strong>to</strong> wear jumpers.<br />
To transform <strong>to</strong> linearity:<br />
1. Calculate predicted values (y pred) and residuals (y − y pred) from the <strong>regression</strong><br />
equation.<br />
2. Observe data and plot residuals.<br />
3. Transform either with y versus x 2 or y versus log 10x depending on the ‘shape’<br />
of the data set.<br />
4. If the gradient is increasing in magnitude as x increases, an x 2 transformation is<br />
appropriate.<br />
5. If the gradient is decreasing in magnitude as x increases, a log e x<br />
transformation is appropriate.<br />
6. When predicting y-values using either the x 2 or log 10 x transformation,<br />
transform the original x-value first.