

Quantifying Uncontrolled Landfill Gas Emissions from Two Florida ...
Quantifying Uncontrolled Landfill Gas Emissions from Two Florida ...
Quantifying Uncontrolled Landfill Gas Emissions from Two Florida ...

Create successful ePaper yourself
Turn your PDF publications into a flip-book with our unique Google optimized e-Paper software.
Chapter 2<br />
Test Procedures<br />
The following subsections describe the test procedures used during the optical remote sensing<br />
measurements at each of the survey cells at the two sites. Refer to Figures 1-1 and 1-2 for the<br />
geographical orientation of each survey cell. For the ORS measurements, 10 mirrors were used<br />
with each ORS instrument for a total of 20 mirrors for each survey within each landfill cell. The<br />
coordinates of the mirrors used in each configuration are presented in Appendix B of this report.<br />
Additionally, the test procedures used to collect the mercury samples, Summa canister samples,<br />
and gas flow measurements, are described below.<br />
2.1 Optical Remote Sensing Measurements at <strong>Landfill</strong> Site #1<br />
2.1.1 Control Cell<br />
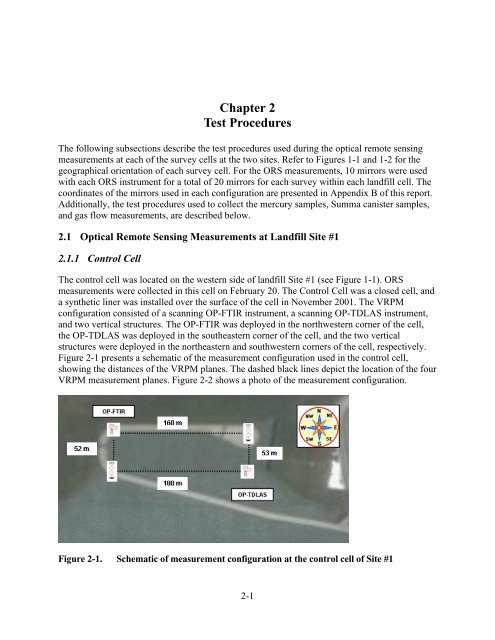
The control cell was located on the western side of landfill Site #1 (see Figure 1-1). ORS<br />
measurements were collected in this cell on February 20. The Control Cell was a closed cell, and<br />
a synthetic liner was installed over the surface of the cell in November 2001. The VRPM<br />
configuration consisted of a scanning OP-FTIR instrument, a scanning OP-TDLAS instrument,<br />
and two vertical structures. The OP-FTIR was deployed in the northwestern corner of the cell,<br />
the OP-TDLAS was deployed in the southeastern corner of the cell, and the two vertical<br />
structures were deployed in the northeastern and southwestern corners of the cell, respectively.<br />
Figure 2-1 presents a schematic of the measurement configuration used in the control cell,<br />
showing the distances of the VRPM planes. The dashed black lines depict the location of the four<br />
VRPM measurement planes. Figure 2-2 shows a photo of the measurement configuration.<br />
Figure 2-1. Schematic of measurement configuration at the control cell of Site #1<br />
2-1


