

Quantifying Uncontrolled Landfill Gas Emissions from Two Florida ...
Quantifying Uncontrolled Landfill Gas Emissions from Two Florida ...
Quantifying Uncontrolled Landfill Gas Emissions from Two Florida ...

Create successful ePaper yourself
Turn your PDF publications into a flip-book with our unique Google optimized e-Paper software.
2.2.2 Bioreactor Cell<br />
The bioreactor cell was located on the northern side of landfill Site #2 (see Figure 1-2). ORS<br />
measurements were collected in this cell on February 23 and 24. The bioreactor cell was an<br />
active cell, and a soil cover had been recently placed over the surface. Although this cell was<br />
classified as a bioreactor cell, according to the site operators, leachate had not been injected into<br />
the cell in several months due to excessive rainfall in the area. The VRPM configuration<br />
consisted of a scanning OP-FTIR instrument, a scanning OP-TDLAS instrument, and two<br />
vertical structures. The OP-FTIR was deployed in the northeastern corner of the cell, the OP<br />
TDLAS was deployed in the southwestern corner of the cell, and the two vertical structures were<br />
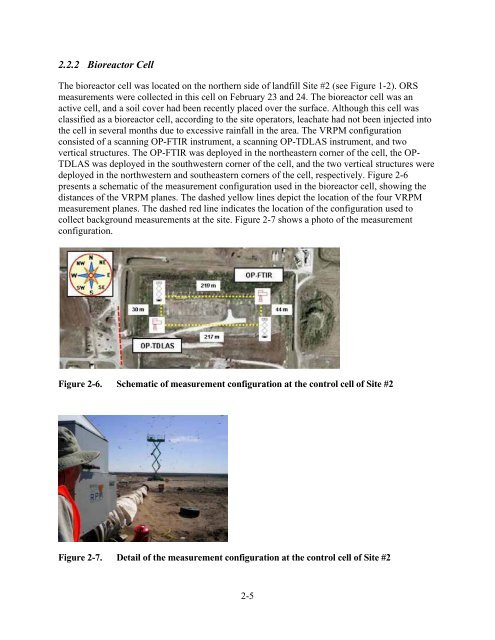
deployed in the northwestern and southeastern corners of the cell, respectively. Figure 2-6<br />
presents a schematic of the measurement configuration used in the bioreactor cell, showing the<br />
distances of the VRPM planes. The dashed yellow lines depict the location of the four VRPM<br />
measurement planes. The dashed red line indicates the location of the configuration used to<br />
collect background measurements at the site. Figure 2-7 shows a photo of the measurement<br />
configuration.<br />
Figure 2-6. Schematic of measurement configuration at the control cell of Site #2<br />
Figure 2-7. Detail of the measurement configuration at the control cell of Site #2<br />
2-5


