Spatial distribution of emissions to air - the SPREAD model
Spatial distribution of emissions to air - the SPREAD model
Spatial distribution of emissions to air - the SPREAD model

Create successful ePaper yourself
Turn your PDF publications into a flip-book with our unique Google optimized e-Paper software.
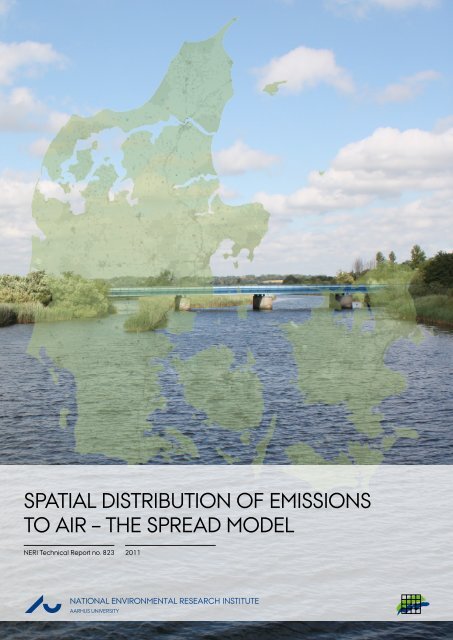
SpATIAL dISTRIbUTION Of EMISSIONS<br />
TO AIR – THE SpREAd MOdEL<br />
NERI Technical Report no. 823 2011<br />
AU<br />
NATIONAL ENVIRONMENTAL RESEARCH INSTITUTE<br />
AARHUS UNIVERSITY
[Blank page]
AU<br />
SpATIAL dISTRIbUTION Of EMISSIONS<br />
TO AIR – THE SpREAd MOdEL<br />
NERI Technical Report no. 823 2011<br />
Marlene S. plejdrup<br />
Steen Gyldenkærne<br />
NATIONAL ENVIRONMENTAL RESEARCH INSTITUTE<br />
AARHUS UNIVERSITY
'DWD VKHHW<br />
Series title and no.: NERI Technical Report No. 823<br />
Title: <strong>Spatial</strong> <strong>distribution</strong> <strong>of</strong> <strong>emissions</strong> <strong>to</strong> <strong>air</strong> – <strong>the</strong> <strong>SPREAD</strong> <strong>model</strong><br />
Authors: Marlene S. Plejdrup & Steen Gyldenkærne<br />
Department: Department <strong>of</strong> Policy Analysis<br />
Publisher: National Environmental Research Institute ©<br />
Aarhus University - Denmark<br />
URL: http://www.neri.dk<br />
Year <strong>of</strong> publication: April 2011<br />
Editing completed: March 2011<br />
Referee: Pr<strong>of</strong>essor Henning Sten Hansen, Aalborg University<br />
Financial support: No external financial support<br />
Please cite as: Plejdrup, M.S. & Gyldenkærne, S. 2011: <strong>Spatial</strong> <strong>distribution</strong> <strong>of</strong> <strong>emissions</strong> <strong>to</strong> <strong>air</strong> – <strong>the</strong> <strong>SPREAD</strong><br />
<strong>model</strong>. National Environmental Research Institute, Aarhus University, Denmark. 72 pp. – NERI<br />
Technical Report no. FR823. http://www.dmu.dk/Pub/FR823.pdf<br />
Reproduction permitted provided <strong>the</strong> source is explicitly acknowledged<br />
Abstract: The National Environmental Research Institute (NERI), Aarhus University, completes <strong>the</strong> annual<br />
national emission inven<strong>to</strong>ries for greenhouse gases and <strong>air</strong> pollutants according <strong>to</strong> Denmark’s<br />
obligations under international conventions, e.g. <strong>the</strong> climate convention, UNFCCC and <strong>the</strong> convention<br />
on long-range transboundary <strong>air</strong> pollution, CLRTAP. NERI has developed a <strong>model</strong> <strong>to</strong><br />
distribute <strong>emissions</strong> from <strong>the</strong> national emission inven<strong>to</strong>ries on a 1x1 km grid covering <strong>the</strong> Danish<br />
land and sea terri<strong>to</strong>ry. The new spatial high resolution <strong>distribution</strong> <strong>model</strong> for <strong>emissions</strong> <strong>to</strong> <strong>air</strong><br />
(<strong>SPREAD</strong>) has been developed according <strong>to</strong> <strong>the</strong> requirements for reporting <strong>of</strong> gridded <strong>emissions</strong><br />
<strong>to</strong> CLRTAP. <strong>Spatial</strong> emission data is e.g. used as input for <strong>air</strong> quality <strong>model</strong>ling, which<br />
again serves as input for assessment and evaluation <strong>of</strong> health effects. For <strong>the</strong>se purposes <strong>distribution</strong>s<br />
with higher spatial resolution have been requested. Previously, a <strong>distribution</strong> on <strong>the</strong><br />
17x17 km EMEP grid has been set up and used in research projects combined with detailed<br />
<strong>distribution</strong>s for a few sec<strong>to</strong>rs or sub-sec<strong>to</strong>rs e.g. a <strong>distribution</strong> for <strong>emissions</strong> from road traffic on<br />
1x1 km resolution. <strong>SPREAD</strong> is developed <strong>to</strong> generate improved spatial emission data for e.g.<br />
<strong>air</strong> quality <strong>model</strong>ling in exposure studies. <strong>SPREAD</strong> includes emission <strong>distribution</strong>s for each sec<strong>to</strong>r<br />
in <strong>the</strong> Danish inven<strong>to</strong>ry system; stationary combustion, mobile sources, fugitive <strong>emissions</strong><br />
from fuels, industrial processes, solvents and o<strong>the</strong>r product use, agriculture and waste. This<br />
<strong>model</strong> enables generation <strong>of</strong> <strong>distribution</strong>s for single sec<strong>to</strong>rs and for a number <strong>of</strong> sub-sec<strong>to</strong>rs and<br />
single sources as well. This report documents <strong>the</strong> methodologies in this first version <strong>of</strong> <strong>SPREAD</strong><br />
and presents selected results. Fur<strong>the</strong>r, a number <strong>of</strong> potential improvements for later versions <strong>of</strong><br />
<strong>SPREAD</strong> are addressed and discussed.<br />
Keywords: <strong>Spatial</strong> emission <strong>distribution</strong>, <strong>air</strong> pollution, greenhouse gases, gridded <strong>emissions</strong>, <strong>SPREAD</strong>,<br />
Layout: Ann-Katrine Holme Christ<strong>of</strong>fersen<br />
ISBN: 978-87-7073-221-1<br />
ISSN (electronic): 1600-0048<br />
Number <strong>of</strong> pages: 72<br />
Internet version: The report is available in electronic format (pdf) at NERI's website<br />
http://www.dmu.dk/Pub/FR823.pdf
&RQWHQWV<br />
/LVW RI DEEUHYLDWLRQV<br />
3UHIDFH<br />
6XPPDU\<br />
6DPPHQIDWQLQJ<br />
,QWURGXFWLRQ<br />
*HQHUDO PHWKRGRORJ\<br />
6SDWLDO GLVWULEXWLRQ RI IXHO FRQVXPSWLRQ DQG HPLVVLRQV IURP WKH<br />
HQHUJ\ VHFWRU<br />
3.1 Stationary combustion 16<br />
3.1.1 LPS 17<br />
3.1.2 PS 17<br />
3.1.3 AS 18<br />
3.1.4 Results for stationary combustion 20<br />
3.2 Mobile sources 22<br />
3.2.1 Road transport 23<br />
3.2.2 Results for road transport 25<br />
3.2.3 Military 26<br />
3.2.4 Railways 26<br />
3.2.5 Navigation 26<br />
3.2.6 Aviation 27<br />
3.2.7 Agriculture, Forestry, Industry, Household & gardening 28<br />
3.2.8 Results for mobile sources 28<br />
3.3 Fugitive Emissions from Fuels 29<br />
3.3.1 Solid fuels 30<br />
3.3.2 Extraction <strong>of</strong> oil and natural gas 30<br />
3.3.3 Offshore flaring 30<br />
3.3.4 Offshore loading 31<br />
3.3.5 Pipeline oil 31<br />
3.3.6 Service stations 31<br />
3.3.7 Transmission <strong>of</strong> natural gas 31<br />
3.3.8 Distribution <strong>of</strong> natural gas 31<br />
3.3.9 Distribution <strong>of</strong> <strong>to</strong>wn gas 32<br />
3.3.10 Oil refining 32<br />
3.3.11 Gas plants 32<br />
3.3.12 Results for fugitive <strong>emissions</strong> from fuels 33<br />
6SDWLDO GLVWULEXWLRQ RI HPLVVLRQV IURP ,QGXVWULDO 3URFHVVHV<br />
4.1 Results for industrial processes 34<br />
6SDWLDO GLVWULEXWLRQ RI HPLVVLRQV IURP 6ROYHQWV DQG RWKHU<br />
SURGXFW XVH<br />
5.1 Results for solvents and o<strong>the</strong>r product use 37<br />
6SDWLDO GLVWULEXWLRQ RI HPLVVLRQV IURP WKH $JULFXOWXUDO VHFWRU<br />
6.1 Enteric Fermentation 40
6.2 Manure Management 40<br />
6.3 Agricultural soils 40<br />
6.3.1 Crops 41<br />
6.3.2 Application <strong>of</strong> manure 41<br />
6.3.3 Application <strong>of</strong> fertiliser 41<br />
6.3.4 N excretion on pasture range and paddock (PRP) 41<br />
6.3.5 NH3 treated straw 41<br />
6.3.6 Crop residue 42<br />
6.3.7 N-fixing crops 42<br />
6.3.8 His<strong>to</strong>sols 42<br />
6.3.9 Leaching 42<br />
6.3.10 Atmospheric deposition 42<br />
6.4 Field burning <strong>of</strong> agricultural residues 43<br />
6.5 O<strong>the</strong>r 43<br />
6.6 Results for agriculture 43<br />
6SDWLDO GLVWULEXWLRQ RI HPLVVLRQV IURP WKH ZDVWH VHFWRU<br />
7.1 Solid waste disposal 45<br />
7.2 Wastewater treatment 45<br />
7.3 Cremations 45<br />
7.4 Compost production 46<br />
7.5 Accidental fires 46<br />
7.6 N2O from human sewage 46<br />
7.7 Results for waste 46<br />
6SDWLDO GLVWULEXWLRQ RI QDWLRQDO HPLVVLRQV<br />
'LVFXVVLRQ DQG SRWHQWLDO LPSURYHPHQWV<br />
9.1 Stationary combustion, point sources 50<br />
9.2 Stationary combustion, area sources 50<br />
9.3 Mobile Sources 51<br />
9.4 Fugitive <strong>emissions</strong> from fuels 51<br />
9.5 Industrial processes 51<br />
9.6 F-gases 51<br />
9.7 Solvents and o<strong>the</strong>r product use 52<br />
9.8 Solid waste disposal 52<br />
9.9 Wastewater treatment 52<br />
9.10 Compost production 52<br />
9.11 Accidental fires 52<br />
&RQFOXVLRQ<br />
5HIHUHQFHV<br />
$SSHQGL[ $ /LVW RI IXHO FRGHV<br />
$SSHQGL[ % /LVW RI 61$3 FRGHV DQG FRUUHVSRQGLQJ 1)5 FDWHJRULHV<br />
$SSHQGL[ & /LVW RI *1)5 FRGHV DQG FRUUHVSRQGLQJ 1)5 FRGHV<br />
1(5, ,QIRUPDWLRQ<br />
1(5, 7HFKQLFDO UHSRUWV
LVW RI DEEUHYLDWLRQV<br />
ADT Annual Daily Traffic<br />
AS Area Sources are sources where nei<strong>the</strong>r <strong>the</strong> fuel consumption<br />
nor <strong>the</strong> emission fac<strong>to</strong>rs are known at plant level. Emission<br />
calculations are based on <strong>the</strong> <strong>to</strong>tal fuel consumption and <strong>the</strong><br />
assumed average emission fac<strong>to</strong>r.<br />
BI5 Approximation for <strong>the</strong> content <strong>of</strong> degradable organic matter<br />
in waste water<br />
CHP Combined heat and power<br />
CHR Central Husbandry Register<br />
CRF Common Reporting Format used for reporting <strong>to</strong> UNFCCC,<br />
EU and <strong>the</strong> Kyo<strong>to</strong> Pro<strong>to</strong>col<br />
DKN Danish Grid Net (Danske Kvadrat Net). The grid is designed<br />
in an orthogonal coordinate system referring <strong>to</strong> <strong>the</strong> UTM projection,<br />
zone 32 using EUREF89. The cells are defined and<br />
named by <strong>the</strong> lower left corner coordinate. The grid can be<br />
set up by <strong>the</strong> freeware program “Kvadratnetmo<strong>to</strong>ren” developed<br />
by Uffe Kousgaard, NERI and hosted by <strong>the</strong> National<br />
Survey and Cadastre:<br />
http://www.kms.dk/Produktkatalog/gratis/kvadratnet.ht<br />
m.<br />
EMEP European Moni<strong>to</strong>ring and Evaluation Programme is a scientifically<br />
based and policy driven programme under <strong>the</strong> Convention<br />
on Long-range Transboundary Air Pollution<br />
FC Fuel consumption<br />
GLR General Agriculture Register<br />
ISAG Information system on waste and recycling (InformationsSystem<br />
for Affald og Genanvendelse) hosted by <strong>the</strong> Danish EPA<br />
LPS Large Point Source with plant or installation specific <strong>emissions</strong><br />
or emission fac<strong>to</strong>rs. LPSs are treated in a separate part<br />
<strong>of</strong> <strong>the</strong> inven<strong>to</strong>ry system and include <strong>emissions</strong> from stationary<br />
combustion, mobile sources (Copenhagen Airport, Kastrup),<br />
fugitive <strong>emissions</strong> and industrial processes.<br />
NFR Nomenclature For Reporting. Table format used for reporting<br />
<strong>to</strong> UNECE and <strong>the</strong> NEC directive<br />
NRTD National Road and Traffic Database<br />
PM Particulate Matter<br />
5
6<br />
PM10<br />
PM2.5<br />
Particulate Matter with an aerodynamic diameter less than 10<br />
µm<br />
Particulate Matter with an aerodynamic diameter less than<br />
2.5 µm<br />
PS Point Sources are sources where <strong>the</strong> fuel consumption is<br />
given on plant or installation level but standard emission fac<strong>to</strong>rs<br />
are used for emission calculations.<br />
ROEM Road Emission Model developed in <strong>the</strong> research project RE-<br />
BECa<br />
SNAP Selected Nomenclature for Air Pollution<br />
<strong>SPREAD</strong> <strong>Spatial</strong> High Resolution Emission <strong>to</strong> Air Distribution Model<br />
TSP Total Suspended Particles<br />
UNECE-CLRTAP United Nations Economic Commission for<br />
Europe - Convention on Long-range Transboundary<br />
Air Pollution<br />
UNFCCC United Nations Framework Convention on Climate Change,<br />
called <strong>the</strong> climate convention
3UHIDFH<br />
This report documents <strong>the</strong> methodology and data foundation for <strong>the</strong><br />
spatial <strong>distribution</strong> <strong>of</strong> <strong>emissions</strong> <strong>to</strong> <strong>air</strong> on high resolution grid. The <strong>distribution</strong><br />
includes <strong>emissions</strong> <strong>of</strong> greenhouse gases and <strong>air</strong> pollutants in<br />
2008 as reported <strong>to</strong> <strong>the</strong> UNFCCC and UNECE -CLRTAP.<br />
The Department <strong>of</strong> Policy Analysis <strong>of</strong> <strong>the</strong> National Environmental Research<br />
Institute (NERI), Aarhus University (AU), has carried out <strong>the</strong><br />
work as part <strong>of</strong> <strong>the</strong> emission inven<strong>to</strong>ry project in preparation for <strong>the</strong><br />
manda<strong>to</strong>ry reporting <strong>of</strong> gridded <strong>emissions</strong> due in <strong>the</strong> spring <strong>of</strong> 2012.<br />
The work on creating an updated <strong>model</strong> for high resolution emission<br />
<strong>distribution</strong> has gained valuable data and information from a number <strong>of</strong><br />
external experts.<br />
The authors would like <strong>to</strong> thank:<br />
The Danish Energy Agency for providing <strong>the</strong> Regional Inven<strong>to</strong>ry <strong>of</strong> energy<br />
consumption for heating for oil boilers, natural gas boilers and solid<br />
fuel installations.<br />
Michael Mucke Jensen, Danish Petroleum Association, for GIS data on<br />
service stations in Denmark.<br />
Martin Sune Møller, Danish Environmental Protection Agency, for delivering<br />
data from <strong>the</strong> ISAG database on waste deposits and waste treatment<br />
plants.<br />
Erling Krappe, Danish Forest and Nature Agency, for delivering data on<br />
military training terrains.<br />
Jørn Hougaard Sørensen, Energinet.dk for data on location <strong>of</strong> transmissions<br />
stations on <strong>the</strong> natural gas network.<br />
Steen Solvang Jensen, Department <strong>of</strong> Atmospheric Environment, <strong>of</strong> <strong>the</strong><br />
National Environmental Research Institute, Aarhus University, for providing<br />
data on road traffic from <strong>the</strong> National Road and Transport Database.<br />
The research project REBECa founded by <strong>the</strong> Strategic Research Council<br />
for providing <strong>the</strong> <strong>emissions</strong> <strong>distribution</strong> <strong>model</strong> for road transport.<br />
Pr<strong>of</strong>essor Henning Sten Hansen, Aalborg University, for reviewing and<br />
contributing valuable comments <strong>to</strong> <strong>the</strong> present report.<br />
7
8<br />
6XPPDU\<br />
The National Environmental Research Institute (NERI), Aarhus University<br />
(AU) completes <strong>the</strong> annual national emission inven<strong>to</strong>ries for greenhouse<br />
gases and <strong>air</strong> pollutants according <strong>to</strong> Denmark’s obligations under<br />
international conventions, e.g. <strong>the</strong> climate convention, UNFCCC and <strong>the</strong><br />
convention on long-range transboundary <strong>air</strong> pollution, CLRTAP.<br />
Previously <strong>the</strong> Danish <strong>emissions</strong> inven<strong>to</strong>ry has been available on 50x50<br />
km EMEP grid for reporting <strong>of</strong> <strong>air</strong> pollutants <strong>to</strong> CLRTAP every fifth<br />
year, latest in 2007 for <strong>the</strong> emission year 2005 and <strong>the</strong> his<strong>to</strong>rical years<br />
1990, 1995 and 2000. The methodology for <strong>the</strong> 50x50 km <strong>distribution</strong> is<br />
described in a Danish-language report (Jensen et al., 2008a).<br />
<strong>Spatial</strong> emission data is e.g. used as input for <strong>air</strong> quality <strong>model</strong>ling,<br />
which again serves as input for assessment and evaluation <strong>of</strong> health effects.<br />
For <strong>the</strong>se purposes <strong>distribution</strong>s with higher spatial resolution has<br />
been requested and NERI carried out an improved <strong>distribution</strong> on <strong>the</strong><br />
17x17 km EMEP grid. This <strong>distribution</strong> has been used in research projects<br />
combined with detailed <strong>distribution</strong>s for one or a few sec<strong>to</strong>rs or<br />
sub-sec<strong>to</strong>rs, e.g. a <strong>distribution</strong> for <strong>emissions</strong> from road traffic on 1x1 km<br />
resolution.<br />
This report describes <strong>the</strong> new spatial high resolution <strong>distribution</strong> <strong>model</strong><br />
for <strong>emissions</strong> <strong>to</strong> <strong>air</strong> (<strong>SPREAD</strong>) that has been developed <strong>to</strong> fulfil <strong>the</strong> requirements<br />
for reporting <strong>of</strong> gridded <strong>emissions</strong> <strong>to</strong> CLRTAP and <strong>to</strong> generate<br />
improved spatial emission data for <strong>air</strong> quality <strong>model</strong>ling in exposure<br />
studies, for one thing.<br />
<strong>SPREAD</strong> includes emission <strong>distribution</strong>s for each sec<strong>to</strong>r in <strong>the</strong> Danish<br />
inven<strong>to</strong>ry system; stationary combustion, mobile sources, fugitive <strong>emissions</strong><br />
from fuels, industrial processes, solvents and o<strong>the</strong>r product use,<br />
agriculture and waste. This enables generation <strong>of</strong> <strong>distribution</strong>s for single<br />
sec<strong>to</strong>rs and for a number <strong>of</strong> sub-sec<strong>to</strong>rs and single sources as well.<br />
This report documents <strong>the</strong> methodologies in this first version <strong>of</strong> <strong>SPREAD</strong><br />
and presents selected results. Fur<strong>the</strong>r, a number <strong>of</strong> potential improvements<br />
for later versions <strong>of</strong> <strong>SPREAD</strong> are addressed and discussed.
6DPPHQIDWQLQJ<br />
Danmarks Miljøundersøgelser (DMU) ved Aarhus Universitet (AU) udarbejder<br />
de årlige nationale <strong>emissions</strong>opgørelser for drivhusgasser og<br />
luftforurenende st<strong>of</strong>fer i henhold til Danmarks forpligtelser til internationale<br />
konventioner, f.eks. FN’s klimakonvention, UNFCCC og konventionen<br />
om langtransporteret luftforurening, CLRTAP.<br />
Tidligere har den danske <strong>emissions</strong>opgørelse været tilgængelig på 50x50<br />
km EMEP grid for rapportering til CLRTAP hvert femte år, senest i 2007<br />
for <strong>emissions</strong>året 2005 og de his<strong>to</strong>riske år 1990, 1995 og 2000. Me<strong>to</strong>den til<br />
fordeling på 50x50 km er beskrevet i Jensen et al. (2008a).<br />
Rumlige <strong>emissions</strong>data bruges som input til <strong>model</strong>beregning af luftkvaliteten,<br />
der igen tjener som input til vurdering og evaluering af virkninger<br />
for sundheden. Til disse formål efterspørges fordelinger med høj<br />
rumlig opløsning og DMU udarbejdede en forbedret fordeling på 17x17<br />
km EMEP grid som, kombineret med mere detaljerede fordelinger for én<br />
eller enkelte sek<strong>to</strong>rer eller delsek<strong>to</strong>rer, f.eks. emissioner fra vejtrafikken<br />
på 1x1 km opløsning, er blevet anvendt i forskningsprojekter.<br />
Denne rapport beskriver den nye <strong>model</strong> <strong>SPREAD</strong> til fordeling af emissioner<br />
til luft med høj opløsning (1x1 km). Modellen er udviklet til at opfylde<br />
kravene til rapportering af rumligt fordelte emissioner til CLRTAP<br />
og til at skabe bedre <strong>emissions</strong>data, f.eks. til <strong>model</strong>beregning af luftkvalitet<br />
i eksponeringen undersøgelser.<br />
<strong>SPREAD</strong> er bygget op om separate fordelings<strong>model</strong>ler for sek<strong>to</strong>rerne i<br />
det danske opgørelsessystem; stationær forbrænding, mobile kilder,<br />
flygtige emissioner fra brændsler, industrielle processer, opløsningsmidler<br />
og anvendelse af andre st<strong>of</strong>fer, landbrug og affald. Dermed er det<br />
muligt at lave fordelinger for enkelte sek<strong>to</strong>rer samt for en række delsek<strong>to</strong>rer<br />
og separate kilder.<br />
Denne rapport dokumenterer me<strong>to</strong>derne i denne første version af<br />
<strong>SPREAD</strong> og præsenterer udvalgte resultater. Desuden er en række potentielle<br />
forbedringer i senere versioner af <strong>SPREAD</strong> beskrevet og diskuteret.<br />
9
10<br />
,QWURGXFWLRQ<br />
The National Environmental Research Institute (NERI), Aarhus University<br />
completes <strong>the</strong> annual national emission inven<strong>to</strong>ries for greenhouse<br />
gases and <strong>air</strong> pollutants. The methodologies in <strong>the</strong> Danish emission inven<strong>to</strong>ries<br />
follows <strong>the</strong> international guidelines provided by <strong>the</strong> IPCC, i.e.<br />
<strong>the</strong> Revised 1996 IPCC Guidelines, <strong>the</strong> 2000 IPCC Good Practice Guidance<br />
for <strong>the</strong> greenhouse gas emission inven<strong>to</strong>ries and <strong>the</strong> EMEP/EEA<br />
Guidebook for <strong>the</strong> emission inven<strong>to</strong>ries for <strong>air</strong> pollution.<br />
According <strong>to</strong> Denmark’s international obligations <strong>the</strong> national emission<br />
inven<strong>to</strong>ries are reported <strong>to</strong> <strong>the</strong> United Nations Framework Convention<br />
on Climate Convention (UNFCCC) and <strong>the</strong> Kyo<strong>to</strong> Pro<strong>to</strong>col, EU’s Moni<strong>to</strong>ring<br />
Mechanism (EU MM), United Nations Economic Commission for<br />
Europe - Convention on Long-Range Transboundary Air Pollution (UN-<br />
ECE - CLRTAP) and <strong>the</strong> National Emission Ceilings Directive (NECD).<br />
The <strong>emissions</strong> are reported as national <strong>to</strong>tals and for a number <strong>of</strong> sec<strong>to</strong>rs<br />
and sub-sec<strong>to</strong>rs as defined by <strong>the</strong> Common Reporting Format (CRF)<br />
used for reporting <strong>to</strong> UNFCCC, EU-MM and <strong>the</strong> Kyo<strong>to</strong> Pro<strong>to</strong>col and <strong>the</strong><br />
Nomenclature For Reporting (NFR) used for reporting <strong>to</strong> CLRTAP and<br />
NECD, respectively.<br />
Emission data from <strong>the</strong> national inven<strong>to</strong>ries are <strong>of</strong>ten used as input <strong>to</strong><br />
<strong>model</strong> <strong>air</strong> quality, which again serves as input in e.g. assessment and<br />
evaluation <strong>of</strong> health effects. In order <strong>to</strong> make a more suitable input for<br />
<strong>air</strong> quality <strong>model</strong>s, <strong>emissions</strong> must be given on a more disaggregated<br />
level than national level. Previously <strong>the</strong> Danish <strong>emissions</strong> inven<strong>to</strong>ry has<br />
been available on 50x50 km EMEP grid for reporting <strong>of</strong> <strong>air</strong> pollutants <strong>to</strong><br />
CLRTAP every fifth year, latest in 2007 for <strong>the</strong> emission year 2005 and<br />
<strong>the</strong> his<strong>to</strong>rical years 2000, 1995 and 1990. The methodology is described in<br />
a Danish-language report (Jensen et al., 2008a).<br />
Besides <strong>the</strong> emission <strong>distribution</strong> on 50x50 km resolution, a <strong>distribution</strong><br />
on <strong>the</strong> 17x17 km EMEP grid has been set up and used in research projects<br />
combined with detailed <strong>distribution</strong>s for relevant sec<strong>to</strong>rs or subsec<strong>to</strong>rs.<br />
The 17x17 km <strong>distribution</strong> has e.g. been used in combination<br />
with a detailed <strong>distribution</strong> <strong>of</strong> <strong>emissions</strong> from road traffic on 1x1 km resolution<br />
in <strong>the</strong> ongoing research project REBECa (Renewable Energy in<br />
<strong>the</strong> transport sec<strong>to</strong>r using Bi<strong>of</strong>uels as Energy Carriers) and <strong>the</strong> completed<br />
project HYSCENE (Environmental and Health Impact Assessment <strong>of</strong><br />
Scenarios for Renewable Energy Systems with Hydrogen). In <strong>the</strong> research<br />
project WOODUSE (Residential wood combustion and <strong>the</strong> interaction<br />
between technology, user and environment) <strong>the</strong> emission <strong>distribution</strong><br />
on 17x17 km has been combined with a detailed <strong>distribution</strong> <strong>of</strong><br />
<strong>emissions</strong> from wood combustion in <strong>the</strong> residential sec<strong>to</strong>r at address level.<br />
In 2010 <strong>the</strong> new spatial high resolution <strong>distribution</strong> <strong>model</strong> for <strong>emissions</strong><br />
<strong>to</strong> <strong>air</strong>, <strong>SPREAD</strong>, is completed at NERI (Department <strong>of</strong> Policy Analysis).<br />
<strong>SPREAD</strong> enables <strong>distribution</strong> <strong>of</strong> <strong>the</strong> Danish <strong>emissions</strong> for all pollutants<br />
and all sec<strong>to</strong>rs in <strong>the</strong> national emission database on a 1x1 km grid covering<br />
Denmark and its national sea terri<strong>to</strong>ry. The <strong>model</strong> does not include
Greenland and <strong>the</strong> Faroe Islands although <strong>the</strong>y are both included in <strong>the</strong><br />
reporting <strong>to</strong> <strong>the</strong> UNFCCC and Greenland is also included in <strong>the</strong> reporting<br />
under <strong>the</strong> Kyo<strong>to</strong> Pro<strong>to</strong>col. The <strong>model</strong> is set up in Micros<strong>of</strong>t Access<br />
databases and <strong>the</strong> <strong>distribution</strong> keys are set up in GIS (ArcMAP). Output<br />
tables are transformed <strong>to</strong> shape files for visualisation in GIS. The projection<br />
for all output shape files are UTM zone 32 N and <strong>the</strong> datum is<br />
ETRS89.<br />
This report presents <strong>the</strong> methodologies in <strong>the</strong> first version <strong>of</strong> <strong>SPREAD</strong><br />
set up for spatial <strong>distribution</strong> <strong>of</strong> <strong>the</strong> Danish emission inven<strong>to</strong>ry for 2008<br />
on <strong>the</strong> 1x1 km Danish Grid Net. The <strong>model</strong> includes <strong>emissions</strong> <strong>of</strong> <strong>the</strong><br />
greenhouse gases carbon dioxide (CO2), methane (CH4), nitrous oxide<br />
(N2O) and <strong>the</strong> F-gases: hydr<strong>of</strong>luorocarbons (HFCs), perfluorocarbons<br />
(PFCs) and sulphur hexafluoride (SF6) as reported <strong>to</strong> <strong>the</strong> UNFCCC on<br />
May 27 th, 2010 (Nielsen et al., 2010a) and <strong>emissions</strong> <strong>of</strong> sulphur dioxide<br />
(SO2), nitrogen oxides (NOx), non-methane volatile organic compounds<br />
(NMVOC), carbon monoxide (CO), ammonia (NH3), <strong>to</strong>tal suspended<br />
particulates (TSP), particulate matter with an aerodynamic diameter less<br />
than 10 µm (PM10), particulate matter with an aerodynamic diameter less<br />
than 2.5 µm (PM2.5), arsenic (As), cadmium (Cd), chromium (Cr), copper<br />
(Cu), mercury (Hg), nickel (Ni), lead (Pb), selenium (Se), zinc (Zn), dioxins<br />
and furans (PCDD/F), hexachlorobenzene (HCB) and <strong>the</strong> polycyclic<br />
aromatic hydrocarbons (PAHs): benzo(b)flouran<strong>the</strong>ne, benzo(k)flouran<strong>the</strong>ne,<br />
benzo(a)pyrene and indeno(1,2,3-c,d)pyrene as reported on February<br />
15 th, 2010 <strong>to</strong> CLRTAP (Nielsen et al., 2010b).<br />
The <strong>distribution</strong> in <strong>SPREAD</strong> is made on SNAP categories <strong>to</strong> assure <strong>the</strong><br />
most accurate <strong>distribution</strong> <strong>of</strong> <strong>the</strong> <strong>emissions</strong>. It has been aimed <strong>to</strong> use <strong>the</strong><br />
most disaggregated SNAP level (SNAP 3 level) but for some categories<br />
and for sec<strong>to</strong>rs SNAP 2 or SNAP 1 level has been applied in <strong>the</strong> <strong>distribution</strong><br />
<strong>model</strong> due <strong>to</strong> lack <strong>of</strong> detailed information (Appendix B: List <strong>of</strong><br />
SNAP codes and corresponding NFR categories). An exception is <strong>the</strong> agricultural<br />
sec<strong>to</strong>r as this sec<strong>to</strong>r is not treated on SNAP level in <strong>the</strong> Danish<br />
emission database. Instead <strong>the</strong> agricultural data processing is carried out<br />
for <strong>the</strong> relevant NFR and CRF categories, and <strong>the</strong> same approach is applied<br />
in <strong>SPREAD</strong>. The <strong>SPREAD</strong> <strong>model</strong> is set up in order <strong>to</strong> be applicable<br />
for <strong>the</strong> manda<strong>to</strong>ry reporting every five years <strong>of</strong> gridded <strong>emissions</strong> <strong>to</strong><br />
CLRTAP next time in 2012 covering <strong>the</strong> emission year 2010 and <strong>the</strong> his<strong>to</strong>rical<br />
years 1990, 1995, 2000 and 2005. The CLRTAP reporting is based<br />
on GNFR categories (Appendix C: List <strong>of</strong> GNFR codes and corresponding<br />
NFR codes) and <strong>the</strong> <strong>distribution</strong>s in <strong>SPREAD</strong> are made on <strong>the</strong> same<br />
or a more disaggregated level than <strong>the</strong> GNFR aggregation level.<br />
<strong>SPREAD</strong> includes a number <strong>of</strong> sub-<strong>model</strong>s covering separate sources or<br />
groups <strong>of</strong> sources in <strong>the</strong> emission inven<strong>to</strong>ry; Large Point Sources, Stationary<br />
combustion for point sources, Stationary combustion for area<br />
sources, Mobile sources, Aviation, Fugitive <strong>emissions</strong>, Industry, F-gases,<br />
Solvents, Waste and a number <strong>of</strong> sub-<strong>model</strong>s for <strong>the</strong> agricultural sec<strong>to</strong>r.<br />
The sub-<strong>model</strong>s correspond <strong>to</strong> <strong>the</strong> methodology and groupings in <strong>the</strong><br />
Danish emission inven<strong>to</strong>ry system and do not for all sec<strong>to</strong>rs match <strong>the</strong><br />
sub-divisions in <strong>the</strong> reporting guidelines when a higher disaggregation<br />
is possible. SNAP and NFR categories are included in all <strong>SPREAD</strong> sub<strong>model</strong>s<br />
<strong>to</strong> enable a <strong>distribution</strong> in agreement with <strong>the</strong> international<br />
guidelines.<br />
11
12<br />
A number <strong>of</strong> plants are treated as Large Point Sources (LPS) in <strong>the</strong> Danish<br />
emission database. The LPSs are characterised by having more detailed<br />
data on fuel consumption, emission fac<strong>to</strong>rs and/or <strong>emissions</strong>, as<br />
plant, installation or process specific data. Emissions from all LPSs are<br />
treated in <strong>the</strong> Large Point Source sub-<strong>model</strong> in <strong>SPREAD</strong>. LPSs represent<br />
<strong>emissions</strong> at all SNAP 1 categories except road traffic (SNAP 07). LPSs in<br />
agriculture (SNAP 10) are included in a separate part <strong>of</strong> <strong>the</strong> emission database<br />
system covering agriculture and are not included in <strong>the</strong> LPS sub<strong>model</strong><br />
in <strong>SPREAD</strong>. The Point Sources sub-<strong>model</strong> covers <strong>emissions</strong> from<br />
stationary combustion from point sources, which refer <strong>to</strong> <strong>the</strong> large number<br />
<strong>of</strong> plants for which <strong>the</strong> fuel consumption is known at plant level but<br />
<strong>emissions</strong> are calculated due <strong>to</strong> standard emission fac<strong>to</strong>rs.<br />
A spatial <strong>distribution</strong> is more relevant for some pollutants, e.g. particulate<br />
matter as <strong>the</strong>y can cause health effects in <strong>the</strong> vicinity <strong>of</strong> <strong>the</strong> emission<br />
site. O<strong>the</strong>r pollutants like <strong>the</strong> greenhouse gasses have no or little health<br />
effect but are more relevant regarding large-scale conditions such as climate<br />
change and global warming. Never<strong>the</strong>less <strong>SPREAD</strong> includes all<br />
pollutants and all sources in <strong>the</strong> Danish inven<strong>to</strong>ry system and <strong>the</strong>reby<br />
provides a complete spatial <strong>distribution</strong> <strong>of</strong> <strong>the</strong> Danish <strong>emissions</strong> on a 1x1<br />
km grid.<br />
In <strong>the</strong> following chapters <strong>the</strong> methodologies <strong>of</strong> <strong>the</strong> <strong>SPREAD</strong> <strong>model</strong> are<br />
described separately for <strong>the</strong> sub-<strong>model</strong>s. The background data and<br />
methodological description applied in <strong>the</strong> national emission inven<strong>to</strong>ry is<br />
not included here. For a description <strong>of</strong> <strong>the</strong> methodologies, data foundation<br />
and <strong>emissions</strong> in <strong>the</strong> national emission inven<strong>to</strong>ries please refer <strong>to</strong><br />
Denmark’s National Inven<strong>to</strong>ry Report, NIR (Nielsen et al., 2010a) as reported<br />
<strong>to</strong> <strong>the</strong> UNFCCC and Denmark’s Informative Inven<strong>to</strong>ry Report,<br />
IIR (Nielsen et al., 2010b) as reported <strong>to</strong> <strong>the</strong> UNECE. Fur<strong>the</strong>r, detailed information<br />
on <strong>the</strong> inven<strong>to</strong>ry for selected sec<strong>to</strong>rs are presented in sec<strong>to</strong>ral<br />
reports for stationary combustion (Nielsen et al., 2010c), mobile sources<br />
(Win<strong>the</strong>r, 2008), fugitive <strong>emissions</strong> (Plejdrup et al., 2009), solvents<br />
(Fauser, 2010), agriculture (Mikkelsen et al., 2006) and waste-water<br />
treatment (Thomsen & Lyck, 2005). For a Danish-language description <strong>of</strong><br />
<strong>the</strong> inven<strong>to</strong>ry for greenhouse gases and Denmark’s international obligations,<br />
please refer <strong>to</strong> (Plejdrup et al., 2009).
*HQHUDO PHWKRGRORJ\<br />
The <strong>distribution</strong> <strong>of</strong> <strong>emissions</strong> in <strong>the</strong> Danish emission inven<strong>to</strong>ry is carried<br />
out in databases and in <strong>the</strong> geographical information system ArcGIS.<br />
The methodology applied in <strong>the</strong> part <strong>of</strong> <strong>the</strong> <strong>distribution</strong> carried out in<br />
GIS is shortly described in this chapter. The description is made for <strong>the</strong><br />
Industrial Processes sec<strong>to</strong>r as case, as this <strong>distribution</strong> is ra<strong>the</strong>r simple.<br />
The emission inven<strong>to</strong>ry for Industrial Processes covers both point<br />
sources and area sources. Emissions from point sources are allocated <strong>to</strong><br />
<strong>the</strong> coordinates given in <strong>the</strong> Danish emission system and are not relevant<br />
in relation <strong>to</strong> <strong>the</strong> GIS procedure. Emissions from area sources are calculated<br />
from production statistics and <strong>the</strong> resulting <strong>emissions</strong> are national<br />
<strong>to</strong>tals as allocation <strong>of</strong> <strong>the</strong> sources (industrial plants) is not possible with<br />
<strong>the</strong> present data foundation. Instead a proxy for <strong>the</strong> <strong>distribution</strong> is applied,<br />
in this case <strong>the</strong> location <strong>of</strong> industrial areas as given in KORT 10 by<br />
<strong>the</strong> National Survey and Cadastre (Figure 2.1). The GIS map <strong>of</strong> industrial<br />
areas is not reflecting differences in <strong>the</strong> location for different industries,<br />
but only holds industrial buildings (referred <strong>to</strong> as <strong>the</strong> industrial area as<br />
<strong>the</strong> buildings are treated as areas ra<strong>the</strong>r than units). The map is a shape<br />
file and <strong>the</strong> industrial areas are polygons.<br />
Figure 2.1 Segment around Avedøre <strong>of</strong> <strong>the</strong> map <strong>of</strong> industrial areas.<br />
As <strong>SPREAD</strong> gives <strong>emissions</strong> on 1x1 km <strong>the</strong> map <strong>of</strong> industrial areas must<br />
be combined with <strong>the</strong> Danish 1x1 km Grid Net. The grid is an orthogonal<br />
coordinate system where <strong>the</strong> cells are defined and named by <strong>the</strong>ir lower<br />
left corner coordinates, e.g. 1km_6 495_735 where 1km refers <strong>to</strong> <strong>the</strong> cell<br />
size, 6 495 refers <strong>to</strong> <strong>the</strong> Y coordinate <strong>of</strong> <strong>the</strong> grid cell (Y = 6 495 000 m) and<br />
375 refers <strong>to</strong> <strong>the</strong> X coordinate (X = 375 000 m). The grid net map is a<br />
shape file and <strong>the</strong> grid cells are polygons (Figure 2.2).<br />
13
14<br />
Figure 2.2 Segment around Avedøre <strong>of</strong> <strong>the</strong> map <strong>of</strong> <strong>the</strong> Danish 1x1 km grid net.<br />
To be able <strong>to</strong> distribute <strong>the</strong> <strong>emissions</strong> on 1x1 km it is necessary <strong>to</strong> split<br />
<strong>the</strong> industrial polygons between <strong>the</strong> grid cells and <strong>the</strong>reby be able <strong>to</strong> calculate<br />
<strong>the</strong> industrial area in each grid cell. These functionalities are available<br />
in a geographical information system (GIS) – in <strong>the</strong> present work<br />
ArcMap is used. The split is made using <strong>the</strong> intersect <strong>to</strong>ol and afterwards<br />
<strong>the</strong> areas are applied <strong>to</strong> each cell using <strong>the</strong> Calculate Area function.<br />
Figure 2.3 Segment around Avedøre <strong>of</strong> <strong>the</strong> map <strong>of</strong> industrial areas and <strong>the</strong> Danish 1x1<br />
km grid net.<br />
The remaining part <strong>of</strong> <strong>the</strong> emission <strong>distribution</strong> is carried out in a database.<br />
The share <strong>of</strong> <strong>the</strong> <strong>emissions</strong> that should be allocated <strong>to</strong> each grid cell<br />
is calculated as <strong>the</strong> industrial area <strong>of</strong> <strong>the</strong> cell divided by <strong>the</strong> <strong>to</strong>tal industrial<br />
area. The same <strong>distribution</strong> key is applied for all pollutants.<br />
In <strong>the</strong> case <strong>of</strong> <strong>the</strong> Industrial Processes sec<strong>to</strong>r only one map is combined<br />
with <strong>the</strong> grid, but more maps or layers could be combined <strong>to</strong> make a <strong>distribution</strong><br />
key. This is <strong>the</strong> case for some sources in <strong>the</strong> agricultural sec<strong>to</strong>r,<br />
e.g. <strong>emissions</strong> from organic soils where <strong>the</strong> <strong>distribution</strong> key is based on a<br />
map <strong>of</strong> organic soils, a map <strong>of</strong> <strong>the</strong> agricultural fields and <strong>the</strong> Danish Grid<br />
Net. A number <strong>of</strong> area sources are distributed on line features, e.g. <strong>emissions</strong><br />
from railways and road traffic. In <strong>the</strong>se cases <strong>the</strong> lines are split in<strong>to</strong><br />
segments by intersection with <strong>the</strong> 1x1 km grid net. The emission in each<br />
grid cell is calculated as <strong>the</strong> national emission multiplied by <strong>the</strong> length <strong>of</strong><br />
<strong>the</strong> line segment(s) in <strong>the</strong> cell and divided by <strong>the</strong> <strong>to</strong>tal length <strong>of</strong> <strong>the</strong> line<br />
feature.
For some sources <strong>the</strong> same <strong>distribution</strong> key can be applied for more or<br />
all years, while o<strong>the</strong>r sources demands a separate <strong>distribution</strong> key for<br />
every year. For Industrial Processes <strong>the</strong> <strong>distribution</strong> key can be applied<br />
for more years, as <strong>the</strong> dataset is not available on annual basis. Fur<strong>the</strong>r,<br />
<strong>the</strong> industrial area does not change much from year <strong>to</strong> year, and <strong>the</strong>refore<br />
<strong>the</strong> gain from setting up <strong>distribution</strong> keys for all years is limited. In<br />
o<strong>the</strong>r cases <strong>the</strong> <strong>distribution</strong> keys must be set up on annual basis as large<br />
changes occur from year <strong>to</strong> year. This is <strong>the</strong> case for e.g. agricultural soils<br />
and point sources (PS) in <strong>the</strong> energy sec<strong>to</strong>r. For a number <strong>of</strong> sources it<br />
would be preferable <strong>to</strong> apply annual <strong>distribution</strong> keys, but it is not possible<br />
as annual data is not available, e.g. for road transport and central<br />
heating plants.<br />
15
16<br />
6SDWLDO GLVWULEXWLRQ RI IXHO FRQVXPSWLRQ<br />
DQG HPLVVLRQV IURP WKH HQHUJ\ VHFWRU<br />
The energy sec<strong>to</strong>r covers three main groups <strong>of</strong> sources called sub-sec<strong>to</strong>rs<br />
and includes <strong>emissions</strong> <strong>of</strong> all pollutants. The sub-sec<strong>to</strong>rs are:<br />
• Stationary combustion, which covers combustion for electricity and<br />
heat production in combined heat and power (CHP) plants and waste<br />
incineration plants, and combustion in households and industry. Fuel<br />
consumption in refineries and for <strong>of</strong>f-shore energy production is also<br />
included in this sec<strong>to</strong>r.<br />
• Mobile sources, which cover combustion <strong>of</strong> fuels in road transport,<br />
railways, national navigation, fishing vessels, aviation and combustion<br />
related <strong>to</strong> use <strong>of</strong> machineries in agriculture, industry and households.<br />
Emissions from electricity driven transport, e.g. trains are included<br />
under Stationary Combustion (power production). Emissions<br />
from international navigation and aviation are given in a special category<br />
– memo items – as <strong>the</strong>se <strong>emissions</strong> are not included in <strong>the</strong> national<br />
<strong>to</strong>tal.<br />
• Fugitive <strong>emissions</strong> from fuels, which cover fugitive <strong>emissions</strong> related<br />
<strong>to</strong> extraction, refining, s<strong>to</strong>rage, transmission and <strong>distribution</strong> <strong>of</strong> fossil<br />
fuels.<br />
The spatial <strong>distribution</strong> <strong>of</strong> <strong>emissions</strong> from <strong>the</strong> energy sec<strong>to</strong>r is made separately<br />
for <strong>the</strong> three sub-sec<strong>to</strong>rs. The only exception is <strong>emissions</strong> from<br />
refineries and gas s<strong>to</strong>rage and treatment plants as <strong>the</strong>se sources are handled<br />
as a Large Point Sources and <strong>the</strong>refore handled in <strong>the</strong> stationary<br />
combustion sub-sec<strong>to</strong>r even though it includes fugitive <strong>emissions</strong> from<br />
fuels.<br />
6WDWLRQDU\ FRPEXVWLRQ<br />
In <strong>the</strong> Danish emission inven<strong>to</strong>ry system stationary combustion is treated<br />
in three groups:<br />
1. Large Point Sources (LPS) are major point sources for which data on<br />
fuel consumption (FC) and plant specific emission fac<strong>to</strong>rs or direct<br />
<strong>emissions</strong> are available <strong>to</strong> a large degree. Data are mainly based on<br />
environmental and annual reports, reports under <strong>the</strong> EU Emission<br />
Trading Scheme (EU ETS) and emission data provided by <strong>the</strong> major<br />
companies in <strong>the</strong> Danish transformation sec<strong>to</strong>r (plant specific data<br />
provided by DONG Energy and Vattenfall). Fur<strong>the</strong>r, a number <strong>of</strong><br />
companies and plants contribute additional data annually or on request.<br />
2. Point sources (PS) are point sources with less detailed data available<br />
on FC and <strong>emissions</strong>. Data on FC are based on <strong>the</strong> annual database<br />
from <strong>the</strong> Danish Energy Agency (DEA) including FC for each district<br />
heating or power producing plant (“Energiproducenttællingen”,<br />
EPT). Some LPS are included in <strong>the</strong> EPT and are <strong>the</strong>refore removed<br />
from <strong>the</strong> dataset <strong>to</strong> avoid double accounting.
3. Area sources (AS) cover <strong>the</strong> remaining FC and corresponding <strong>emissions</strong><br />
for stationary combustion. The FC for AS are calculated as <strong>the</strong><br />
difference between <strong>the</strong> FC given in <strong>the</strong> Danish energy statistics published<br />
by <strong>the</strong> DEA (DEA, 2009) and <strong>the</strong> sum <strong>of</strong> LPS and PS.<br />
/36<br />
Emissions from LPS are implemented in <strong>the</strong> inven<strong>to</strong>ry system in one <strong>of</strong><br />
three ways:<br />
1. FC and <strong>emissions</strong> are given in environmental reports or similar plant<br />
specific reports at part level.<br />
2. FC is given at part level but <strong>emissions</strong> are aggregated for some or all<br />
parts.<br />
3. FC is given while <strong>emissions</strong> are estimated according <strong>to</strong> standard<br />
emission fac<strong>to</strong>rs.<br />
As LPS <strong>emissions</strong> appears in different ways in <strong>the</strong> inven<strong>to</strong>ry system a<br />
module has been developed <strong>to</strong> au<strong>to</strong>mate <strong>the</strong> data handling in order <strong>to</strong><br />
extract <strong>emissions</strong> in <strong>the</strong> right order (1: direct <strong>emissions</strong>, 2: <strong>emissions</strong> estimated<br />
from activity data and emission fac<strong>to</strong>rs). Fur<strong>the</strong>r <strong>the</strong> <strong>model</strong> deals<br />
with unit conversions. The latter require some manual checks as a few<br />
LPS in <strong>the</strong> industrial sec<strong>to</strong>r do not follow <strong>the</strong> general unit definitions.<br />
The emission inven<strong>to</strong>ry database system includes CO2 <strong>emissions</strong> from<br />
biomass. These <strong>emissions</strong> are subtracted from <strong>the</strong> <strong>emissions</strong> in <strong>the</strong> spatial<br />
<strong>distribution</strong> according <strong>to</strong> <strong>the</strong> guidelines for inven<strong>to</strong>ries for UNFCCC.<br />
The bi<strong>of</strong>uels included in <strong>the</strong> inven<strong>to</strong>ry are wood and similar wood<br />
wastes, municipal waste (<strong>the</strong> biogenic part), straw, bio oil, biogas and<br />
biomass producer gas.<br />
The CO2 emission from combustion <strong>of</strong> municipal waste in stationary<br />
combustion is split in two parts; one for <strong>the</strong> fossil part and one for <strong>the</strong><br />
biogenic part <strong>of</strong> <strong>the</strong> municipal waste. Only CO2 from combustion <strong>of</strong> <strong>the</strong><br />
fossil part is included in <strong>SPREAD</strong>. The CO2 emission from <strong>the</strong> fossil part<br />
<strong>of</strong> municipal waste in stationary combustion is calculated as an area<br />
source in <strong>the</strong> Danish inven<strong>to</strong>ry system but is reallocated <strong>to</strong> LPS in<br />
<strong>SPREAD</strong> <strong>to</strong> ensure <strong>the</strong> right allocation defined by <strong>the</strong> fuel combustion at<br />
<strong>the</strong> waste incineration plants.<br />
To avoid errors in <strong>the</strong> data handling a number <strong>of</strong> checks are carried out<br />
at different steps in <strong>the</strong> <strong>model</strong>. The checks cover units, null values and<br />
sums.<br />
36<br />
The <strong>distribution</strong> <strong>of</strong> <strong>emissions</strong> from stationary combustion at point sources<br />
is based on a database from DEA including fuel consumption for<br />
each district heating or power-producing plant on fuel and combustion<br />
technology (e.g. gas turbine, stationary engine or boilers, which are fur<strong>the</strong>r<br />
divided by capacity; < 50 MW, 50 – 300 MW and > 300 MW). The<br />
DEA database is in <strong>the</strong> following referred <strong>to</strong> as EPT. Each <strong>of</strong> <strong>the</strong> 2 189<br />
production units in <strong>the</strong> 2008 EPT is assigned with SNAP 3 codes and<br />
geographical coordinates and <strong>emissions</strong> are calculated from <strong>the</strong> FC given<br />
in EPT and standard emission fac<strong>to</strong>rs for all pollutants for <strong>the</strong> specific<br />
17
18<br />
technology from national research or international guidelines (IPCC,<br />
1996; IPCC, 2000; EMEP/EEA, 2009).<br />
$6<br />
AS includes all sources where only standard emission fac<strong>to</strong>rs are available<br />
and where <strong>the</strong> fuel consumption is estimated as <strong>the</strong> difference between<br />
<strong>the</strong> national <strong>to</strong>tal fuel consumption given in <strong>the</strong> Energy Statistics<br />
and <strong>the</strong> sum <strong>of</strong> fuel consumption for LPS and PS (eq. 2.1). This part <strong>of</strong><br />
<strong>the</strong> inven<strong>to</strong>ry covers all pollutants.<br />
)& = )& − ( )& + )& ) (eq. 2.1)<br />
<br />
<br />
<br />
<br />
where FC refers <strong>to</strong> fuel consumption and DK refers <strong>to</strong> <strong>the</strong> national <strong>to</strong>tal.<br />
The fuel consumption in <strong>the</strong> basic data table (DEA, 2009) is available on<br />
SNAP 2 level while <strong>the</strong> EPT is available on SNAP 3 level. Therefore <strong>the</strong><br />
subtraction lined out in eq. 2.1 gives rise <strong>to</strong> fuel deficits for a number <strong>of</strong><br />
SNAP categories. Every single fuel deficit is treated manually by transferring<br />
<strong>the</strong> deficit <strong>to</strong> ano<strong>the</strong>r SNAP with <strong>the</strong> most similar emission properties.<br />
The fuel re-allocation causes differences between <strong>the</strong> <strong>emissions</strong> calculated<br />
in <strong>SPREAD</strong> and in <strong>the</strong> Danish <strong>emissions</strong> inven<strong>to</strong>ry system, as <strong>the</strong><br />
re-allocated fuel is combined with a different set <strong>of</strong> emission fac<strong>to</strong>rs in<br />
<strong>SPREAD</strong>. The emission fac<strong>to</strong>rs applied in <strong>SPREAD</strong> reflect standard conditions<br />
as <strong>the</strong> fuel consumption is not divided in<strong>to</strong> different technologies.<br />
It is not possible <strong>to</strong> distinguish between e.g. boilers with different<br />
capacity, turbines and stationary engines, as this would require data on<br />
SNAP 3 level.<br />
Corrections are applied <strong>to</strong> ensure that <strong>the</strong> calculated <strong>emissions</strong> in<br />
<strong>SPREAD</strong> equal <strong>the</strong> <strong>emissions</strong> in <strong>the</strong> national inven<strong>to</strong>ry. The correction is<br />
carried out in <strong>SPREAD</strong> for each combination <strong>of</strong> fuel, SNAP 2 and pollutant<br />
category.<br />
To avoid errors in <strong>the</strong> data handling a number <strong>of</strong> checks are carried out<br />
at different steps in <strong>the</strong> <strong>model</strong>. The checks cover units, null values and<br />
sums. Fur<strong>the</strong>r, a number <strong>of</strong> checks are incorporated in <strong>the</strong> <strong>model</strong> <strong>to</strong><br />
check that all data are transferred correctly from one step <strong>to</strong> ano<strong>the</strong>r.<br />
The spatial <strong>distribution</strong> is carried out in a separate database in <strong>the</strong><br />
<strong>SPREAD</strong> <strong>model</strong> based on <strong>the</strong> calculated <strong>emissions</strong>. As no information on<br />
<strong>the</strong> location <strong>of</strong> <strong>the</strong> area sources is available <strong>the</strong> choice <strong>of</strong> <strong>distribution</strong> keys<br />
is <strong>to</strong> a large degree based on expert judgements.<br />
All area source <strong>emissions</strong> at SNAP 0101 and 0102 are distributed according<br />
<strong>to</strong> <strong>the</strong> <strong>distribution</strong> <strong>of</strong> PS for SNAP 0101 and 0102, respectively (Appendix<br />
B: List <strong>of</strong> SNAP codes and corresponding NFR categories). The<br />
reason for choosing <strong>the</strong> PS emission as key is that <strong>the</strong> fuel consumption<br />
at SNAP 0101 and 0102 should all be covered in LPS and PS, as <strong>the</strong>se two<br />
classes <strong>to</strong>ge<strong>the</strong>r cover all plants that deliver power and heating <strong>to</strong> <strong>the</strong><br />
public network. The relatively small fuel consumption for public power<br />
and electricity plants in AS is due <strong>to</strong> different accounting methods. In<br />
2008 <strong>the</strong> fuel consumption at SNAP 0101 and 0102 allocated on area
sources made up only 1 % <strong>of</strong> <strong>the</strong> <strong>to</strong>tal fuel consumption for <strong>the</strong> relevant<br />
fuels (coal, gas oil, bio oil, natural gas, LPG and biomass producer gas).<br />
AS <strong>emissions</strong> at SNAP 0103 are distributed evenly between <strong>the</strong> two Danish<br />
refineries. Again, <strong>the</strong> fuel consumption for AS results from different<br />
accounting methods. As for SNAP 0101 and 0102 only a minor amount <strong>of</strong><br />
fuels are allocated at AS and by far <strong>the</strong> major part at LPS. In 2008 <strong>the</strong> fuel<br />
consumption at SNAP 0103 allocated on area sources made up 5 % <strong>of</strong> <strong>the</strong><br />
<strong>to</strong>tal fuel consumption for <strong>the</strong> relevant fuels (residual oil, gas oil and refinery<br />
gas).<br />
Emissions at SNAP 0105 are allocated on <strong>the</strong> <strong>of</strong>fshore installations. The<br />
<strong>emissions</strong> are distributed evenly between all <strong>of</strong>fshore installations with<br />
production, as no information is available <strong>to</strong> differentiate <strong>the</strong> FC between<br />
<strong>the</strong> installations.<br />
DEA has made an inven<strong>to</strong>ry <strong>of</strong> <strong>the</strong> FC used for regional heating for 2005<br />
“Regional inven<strong>to</strong>ry <strong>of</strong> energy consumption for heating for oil boilers,<br />
natural gas boilers and solid fuel installations” (in <strong>the</strong> following called<br />
<strong>the</strong> Regional Inven<strong>to</strong>ry). The inven<strong>to</strong>ry is based on <strong>the</strong> building and<br />
housing register (BBR) per ultimo 2005, which holds information on i.a.<br />
construction year, living area and primary and secondary heating installation<br />
at address level. The conversion from net heating requirement <strong>to</strong><br />
gross energy consumption is based on efficiencies for heating installations<br />
as given in <strong>the</strong> Energy Statistics. The FCs are given for <strong>the</strong> 271 Danish<br />
municipalities as <strong>the</strong>y appeared before <strong>the</strong> municipality reform in<br />
2007. The inven<strong>to</strong>ry covers four SNAP categories, seven fuels and four<br />
heating categories (Table 3.1).<br />
Table 3.1 SNAP, fuel and heating installations categories in <strong>the</strong> Regional Inven<strong>to</strong>ry <strong>of</strong> energy consumption for<br />
heating for oil boilers, natural gas boilers and solid fuel installations by <strong>the</strong> Danish Energy Agency.<br />
SNAP category and SNAP code Fuel name and fuel code Heating installation category<br />
Commercial and institutional plants – 0201 Steam coal – 102 Oil fired boiler<br />
Residential plants – 0202 Brown coal briquettes – 106 Natural gas fired boiler<br />
Plants in agriculture, forestry and aquaculture – 0203 Wood – 111 O<strong>the</strong>r district heating<br />
Manufacturing industries and construction - 0301 Municipal waste – 114<br />
Oven coke – 107<br />
Straw – 117<br />
Gas oil – 204<br />
Natural gas – 301<br />
Ovens/o<strong>the</strong>r<br />
To create a <strong>distribution</strong> key an intersection between <strong>the</strong> municipalities<br />
and <strong>the</strong> Danish 1x1 km Grid Net is carried out. Following, this is combined<br />
with <strong>the</strong> <strong>distribution</strong> <strong>of</strong> <strong>the</strong> FC at SNAP 2 and fuel level.<br />
The combustion <strong>of</strong> residual oil (fuel 203) at SNAP 02 is distributed according<br />
<strong>to</strong> <strong>the</strong> location <strong>of</strong> industrial areas in Denmark, as this fuel is<br />
mainly used in industries. The location <strong>of</strong> <strong>the</strong> industrial area is based on<br />
KORT 10 by <strong>the</strong> National Survey and Cadastre. The same <strong>distribution</strong><br />
key is used for FC for all fuels at SNAP 0303.<br />
For <strong>the</strong> remaining fuels at SNAP 0202 no data are available that give information<br />
on <strong>the</strong> spatial <strong>distribution</strong>. A number <strong>of</strong> potential methods are<br />
considered, here among <strong>distribution</strong> according <strong>to</strong> LPS and/or PS, according<br />
<strong>to</strong> <strong>distribution</strong> <strong>of</strong> buildings, urban areas or population. The final<br />
19
20<br />
choice <strong>of</strong> methodology has been <strong>to</strong> distribute <strong>the</strong> FC according <strong>to</strong> <strong>the</strong> inven<strong>to</strong>ry<br />
for regional heating by DEA for <strong>the</strong> fuels with <strong>the</strong> most similar<br />
use pattern:<br />
• Petroleum coke and LPG (fuel 110 and 303) are distributed as wood.<br />
• Biogas and gas from waste tips (fuel 309 and 310) are distributed as<br />
straw as <strong>the</strong>y are all related <strong>to</strong> agriculture.<br />
• Bio oil and kerosene (fuel 215 and 206) are distributed as gas oil.<br />
• Brown coal briquettes (fuel 106) are distributed as oven coke as no<br />
<strong>distribution</strong> key can be made for brown coal briquettes as <strong>the</strong> FC was<br />
0 in 2005 in <strong>the</strong> Regional Inven<strong>to</strong>ry.<br />
Table 3.2 gives a complete list <strong>of</strong> <strong>distribution</strong> keys for <strong>emissions</strong> from<br />
area sources in <strong>the</strong> categories 01, 02 and 03 at SNAP 1 level.<br />
Table 3.2 Distribution keys for all categories in SNAP 1 categories 01, 02 and 03.<br />
SNAP* Fuel ** Distribution key Note<br />
0101 All PS<br />
0102 All PS<br />
0103 All Refineries, evenly<br />
0105 All Offshore installations, evenly<br />
0201, 0202, 0203, 0301 102, 107, 111, 114, Regional Inven<strong>to</strong>ry <strong>of</strong> energy consumption for heating for<br />
117, 204, 301 oil boilers, natural gas boilers and solid fuel installations<br />
0201, 0202, 0203, 0301 203 Industrial areas<br />
0201, 0202, 0203, 0301 110, 303 As fuel 111<br />
0201, 0202, 0203, 0301 309, 310 As fuel 117<br />
0201, 0202, 0203, 0301 215, 206 As fuel 204<br />
0201, 0202, 0203, 0301 106 As fuel 107<br />
0303 All Industrial areas Emissions without associated<br />
fuel consumption<br />
* A complete list <strong>of</strong> SNAP codes is given in Appendix B: List <strong>of</strong> SNAP codes and<br />
corresponding NFR categories.<br />
** A complete list <strong>of</strong> fuels is given in Appendix A: List <strong>of</strong> fuel codes.<br />
To avoid errors in <strong>the</strong> data handling a number <strong>of</strong> checks are carried out<br />
at different steps in <strong>the</strong> <strong>model</strong>. The checks cover units, null values and<br />
sums.<br />
5HVXOWV IRU VWDWLRQDU\ FRPEXVWLRQ<br />
Figure 3.1 shows <strong>the</strong> spatial <strong>distribution</strong> <strong>of</strong> SO2 <strong>emissions</strong> from stationary<br />
combustion, which is <strong>the</strong> aggregated result <strong>of</strong> <strong>the</strong> <strong>model</strong>s for Large<br />
Point Sources, Point Sources and Area Sources excluding LPS <strong>emissions</strong><br />
from industrial processes and mobile sources. Emissions are <strong>to</strong> a large<br />
degree located on point sources (LPS and PS). To enhance areas with<br />
large <strong>emissions</strong> <strong>the</strong> relevant grid cells are symbolised with circles, which<br />
sizes represent <strong>the</strong> emission amounts. Notice that <strong>the</strong> enhanced grid cells<br />
might cover more than one point source.
Figure 3.1 Emission <strong>of</strong> SO2 from Stationary Combustion in 2008. Green and blue areas are land and sea areas without<br />
<strong>emissions</strong>. The grid cells with largest <strong>emissions</strong> are enhanced by use <strong>of</strong> symbols.<br />
The <strong>distribution</strong> <strong>of</strong> e.g. PM2.5 is less dominated by <strong>emissions</strong> from point<br />
sources than SO2 (Figure 3.2). The main reason that area sources are<br />
more dominating for PM2.5 than for SO2 is <strong>the</strong> large share <strong>of</strong> PM2.5 <strong>emissions</strong><br />
originating from wood combustion in households, mainly from<br />
wood fired s<strong>to</strong>ves, ovens and boilers. The flue gas cleaning for particulate<br />
matter is very efficient at many large plants and <strong>the</strong> <strong>emissions</strong> have<br />
shown a marked decrease in <strong>the</strong> later years. In residential plants no flue<br />
gas cleaning is installed and <strong>the</strong> <strong>emissions</strong> have increased due <strong>to</strong> increasing<br />
wood consumption, even though <strong>the</strong> newer s<strong>to</strong>ves and ovens have<br />
improved combustion technology.<br />
21
22<br />
Figure 3.2 Emission <strong>of</strong> PM2.5 from Stationary Combustion in 2008. Green and blue areas are land and sea areas without<br />
<strong>emissions</strong>. The grid cells with largest <strong>emissions</strong> are enhanced by use <strong>of</strong> symbols.<br />
0RELOH VRXUFHV<br />
This sub-sec<strong>to</strong>r includes <strong>emissions</strong> from road transport, railways, navigation<br />
and aviation. Fur<strong>the</strong>r, transport and use <strong>of</strong> machinery in military,<br />
agriculture, forestry, industry and household and gardening is included.<br />
This part <strong>of</strong> <strong>the</strong> inven<strong>to</strong>ry includes <strong>emissions</strong> <strong>of</strong> all pollutants except<br />
HCB. Maps <strong>of</strong> <strong>air</strong>port areas, forest areas, industrial areas, one-s<strong>to</strong>rage<br />
buildings and <strong>the</strong> railway network are based on KORT 10 by <strong>the</strong> National<br />
Survey and Cadastre.<br />
Distributions <strong>of</strong> <strong>emissions</strong> from o<strong>the</strong>r mobile sources than road transportation<br />
follow <strong>the</strong> methodology from <strong>the</strong> latest reporting for CLRTAP in<br />
2007 (Jensen et al., 2008a). The data used for <strong>the</strong> 2007 <strong>distribution</strong> has<br />
been applied as no updated or more detailed data are available or because<br />
<strong>the</strong> introduction <strong>of</strong> new methodologies is considered <strong>to</strong> bring no<br />
significant improvements <strong>to</strong> <strong>the</strong> <strong>model</strong>. The 2007 methodologies are applied<br />
for military, railways, agriculture, forestry, industry and household<br />
& gardening. For navigation <strong>the</strong> 2007 methodology has been applied, but<br />
<strong>the</strong> <strong>distribution</strong> is different as <strong>the</strong> borders for <strong>the</strong> sea terri<strong>to</strong>ry are not<br />
identical. In <strong>SPREAD</strong> <strong>the</strong> sea terri<strong>to</strong>ry refers <strong>to</strong> <strong>the</strong> Exclusive Economic<br />
Zone (EEZ) in which Denmark has <strong>the</strong> right <strong>to</strong> exploration and exploit <strong>of</strong><br />
<strong>the</strong> natural resources. Fur<strong>the</strong>r, <strong>the</strong> 2007 methodology is applied for<br />
cruise (national aviation) while a new methodology is applied for national<br />
and international landing and take-<strong>of</strong>f (LTO).
5RDG WUDQVSRUW<br />
Emissions from road transport are distributed by use <strong>of</strong> <strong>the</strong> Road Emission<br />
Distribution Model (ROEM) prepared for work package II in <strong>the</strong> research<br />
project REBECa funded by <strong>the</strong> Danish Council for Strategic Research.<br />
ROEM is based on a Danish national GIS-based road network<br />
and traffic database for 1960-2005 (Jensen et al., 2008b). In <strong>the</strong> following<br />
this work will be referred <strong>to</strong> as <strong>the</strong> national road and traffic database<br />
(NRTD).<br />
The national road and traffic database holds data on annual average daily<br />
traffic (ADT) for every fifth year. ADT is split in<strong>to</strong> five road types (mo<strong>to</strong>rways,<br />
express ways, road width > 6 m, road width 3 – 6 m and road<br />
width < 3 m) and four vehicle types (passenger cars, vans, trucks and<br />
busses) (Table 3.3). The database provides information for each segment<br />
<strong>of</strong> <strong>the</strong> road network on e.g. road type and ADT for different vehicle<br />
types. The <strong>model</strong>led data is aggregated at <strong>the</strong> Danish grid with <strong>the</strong> resolution<br />
1x1 km. For a detailed description <strong>of</strong> <strong>the</strong> <strong>model</strong> refer <strong>to</strong> Jensen et<br />
al. (2008).<br />
Table 3.3 Road and vehicle types in <strong>the</strong> national<br />
road and traffic database.<br />
Road type Vehicle type<br />
Road width < 3 m Passenger cars<br />
Road width 3 – 6 m Vans<br />
Road width > 6 m Trucks<br />
Expressways<br />
Mo<strong>to</strong>rways<br />
Busses<br />
ROEM calculations for 2008 are based on ADT for 2005, which is <strong>the</strong><br />
most recent year in <strong>the</strong> national road and traffic database. It is assumed<br />
that <strong>the</strong> spatial <strong>distribution</strong> <strong>of</strong> ADT has not changed significantly from<br />
2005 <strong>to</strong> 2008 and hence that <strong>the</strong> 2005 <strong>distribution</strong> is appropriate for 2008.<br />
The <strong>distribution</strong> for road traffic is carried out in ROEM for nine categories<br />
defined by <strong>the</strong> combination <strong>of</strong> three vehicle categories (passenger<br />
cars, vans and heavy duty) and three road categories (mo<strong>to</strong>rways, urban<br />
roads and rural roads) as lined out in Table 3.4. This categorisation is <strong>the</strong><br />
same that is used for calculations in <strong>the</strong> national emission inven<strong>to</strong>ry system.<br />
Table 3.4 Road and vehicle types used in ROEM.<br />
Road type Vehicle type<br />
Roads in urban areas, U Passenger cars and two-wheelers, P<br />
Roads in rural areas, R Vans, V<br />
Highway, H Heavy duty (trucks and busses), T<br />
The ADT for highways can be transferred directly <strong>to</strong> <strong>the</strong> <strong>distribution</strong> as it<br />
occurs in both NRTD and in <strong>the</strong> Danish inven<strong>to</strong>ry system. ADT for <strong>the</strong><br />
remaining road categories are summarised and divided between urban<br />
and rural areas. The urban/rural split is made in accordance with <strong>the</strong><br />
proportion <strong>of</strong> each grid cell located in urban/rural areas, which is analysed<br />
in GIS (ArcMAP) by intersection <strong>of</strong> a map covering urban zones<br />
and <strong>the</strong> Danish 1x1 km grid. The urban zone map used in <strong>the</strong> spatial<br />
analysis is based on <strong>the</strong> zone map from 2007 from <strong>the</strong> Agency for <strong>Spatial</strong><br />
23
24<br />
and Environmental Planning slightly modified by adding a small number<br />
<strong>of</strong> urban areas from a zone map from AIS in 1999 (Levin, 2009).<br />
ADT <strong>of</strong> roads in urban areas is determined for each grid cell based on <strong>the</strong><br />
assumption that roadwork is distributed in <strong>the</strong> same proportion as <strong>the</strong><br />
area <strong>of</strong> urban and rural areas within each grid cell. This approach is chosen<br />
over an analysis <strong>of</strong> <strong>the</strong> entire road network since it is far less labour<br />
intensive and since it is assumed that <strong>the</strong> benefit <strong>to</strong> <strong>the</strong> <strong>to</strong>tal uncertainty<br />
will be insignificant, <strong>the</strong> purpose (<strong>model</strong>ling <strong>of</strong> <strong>air</strong> quality) taken in<strong>to</strong> account.<br />
The same approach is applied for roads in rural areas. Figure 3.3<br />
shows <strong>the</strong> traffic load for passenger cars on <strong>the</strong> Danish road network aggregated<br />
on <strong>the</strong> 1x1 km grid.<br />
Figure 3.3 Traffic load for passenger cars including two-wheelers on <strong>the</strong> Danish road network according <strong>to</strong> <strong>the</strong> National<br />
Road and Traffic Database (NRTD).<br />
A set <strong>of</strong> <strong>distribution</strong> keys based on ADT for <strong>the</strong> nine categories is set up<br />
in a Micros<strong>of</strong>t Access database <strong>model</strong> for subsequent data processing. A<br />
number <strong>of</strong> checks are run <strong>to</strong> test <strong>the</strong> <strong>model</strong> e.g. sum check <strong>of</strong> <strong>the</strong> <strong>to</strong>tal<br />
ADT. Fur<strong>the</strong>r, a visual validation is made in GIS <strong>to</strong> ensure that all grid<br />
cells with an associated ADT are located on land or at <strong>the</strong> road network<br />
including piers and bridges. A grid net covering a square around <strong>the</strong><br />
Danish economic zone is applied <strong>to</strong> ensure that cells outside <strong>the</strong> border<br />
<strong>of</strong> <strong>the</strong> Danish area <strong>of</strong> land is not lost during data processing.<br />
The Danish emission inven<strong>to</strong>ry system includes mileage comparable <strong>to</strong><br />
ADT in NRTD. Deviations between ADT and mileage are expected as<br />
<strong>the</strong>y are based on different input data and methodology. The deviations<br />
owe <strong>to</strong> differences in assumptions <strong>of</strong> <strong>the</strong> <strong>to</strong>tal ADT and <strong>to</strong> difference in<br />
<strong>the</strong> estimation <strong>of</strong> traffic loads for <strong>the</strong> road and vehicle categories. A comparison<br />
<strong>of</strong> ADT and mileage is made <strong>to</strong> identify and quantify <strong>the</strong> devia-
tion. Two categories stand out with particular large deviations; passenger<br />
cars in rural areas and heavy duty on highways. The deviations are<br />
shown in Table 3.5.<br />
Table 3.5 Deviation (%) on summarised ADT in <strong>the</strong> national road and<br />
traffic database and mileage in <strong>the</strong> Danish <strong>emissions</strong> inven<strong>to</strong>ry. Negative<br />
values indicate that ADT is less than <strong>the</strong> corresponding mileage.<br />
U R H<br />
P - 13 66 10<br />
V - 37 6 9<br />
T - 27 - 10 - 59<br />
For passenger cars on rural road <strong>the</strong> divergence can be explained in <strong>the</strong><br />
methodology applied in <strong>the</strong> NRTD. As input data were missing for a<br />
number <strong>of</strong> road segments (mainly roads with road width less that 3 m in<br />
rural areas) <strong>the</strong>y were all assigned with a default ADT value. The default<br />
value might be <strong>to</strong>o high and <strong>the</strong>reby lead <strong>to</strong> an overestimation <strong>of</strong> ADT.<br />
The comparison shows that ADT for passenger cars on rural roads is 66<br />
% higher than <strong>the</strong> corresponding mileage in <strong>the</strong> emission inven<strong>to</strong>ry.<br />
For heavy duty on highway <strong>the</strong> divergence is due <strong>to</strong> a correction <strong>of</strong> <strong>the</strong><br />
mileage applied in <strong>the</strong> Danish inven<strong>to</strong>ry system. The fuel consumption<br />
in <strong>the</strong> emission inven<strong>to</strong>ry is required <strong>to</strong> equal <strong>the</strong> sale amounts given in<br />
<strong>the</strong> Energy Statistics by DEA (DEA, 2009). This is not <strong>the</strong> case for <strong>the</strong> fuel<br />
consumption estimated from <strong>the</strong> mileage included in <strong>the</strong> inven<strong>to</strong>ry,<br />
which assumingly owe <strong>to</strong> refuelling <strong>of</strong> foreign vehicles in Denmark.<br />
Most refuelling <strong>of</strong> foreign vehicles is expected <strong>to</strong> concern long distance<br />
transport (trucks and buses). Fur<strong>the</strong>r, it is expected that foreign traffic<br />
mainly occurs on highways. Therefore <strong>the</strong> mileage for heavy duty on<br />
highway is upscaled so <strong>the</strong> <strong>to</strong>tal fuel consumption equals <strong>the</strong> actual fuel<br />
sale in <strong>the</strong> current year.<br />
Emissions from road traffic are split between exhaust and non-exhaust in<br />
<strong>the</strong> Danish inven<strong>to</strong>ry system. Exhaust includes <strong>emissions</strong> <strong>of</strong> all pollutants.<br />
Non-exhaust covers <strong>emissions</strong> from tire and brake wear and from<br />
road abrasion and only includes <strong>emissions</strong> <strong>of</strong> particulate matter (TSP,<br />
PM10 and PM2.5). The inven<strong>to</strong>ry for both exhaust and non-exhaust are divided<br />
in<strong>to</strong> <strong>the</strong> nine categories listed in Table 3.4.<br />
Emissions for 2008 for each <strong>of</strong> <strong>the</strong> 18 categories (nine for exhaust and<br />
nine for non-exhaust) are extracted from <strong>the</strong> national emission inven<strong>to</strong>ry<br />
<strong>model</strong> for road traffic. In ROEM <strong>the</strong> <strong>emissions</strong> are distributed spatially<br />
according <strong>to</strong> <strong>the</strong> nine <strong>distribution</strong> keys based on NRTD on 1x1 km grid.<br />
5HVXOWV IRU URDG WUDQVSRUW<br />
NOx <strong>emissions</strong> from road traffic are shown in Figure 3.4. The largest<br />
<strong>emissions</strong> are located on <strong>the</strong> major road network as is <strong>the</strong> largest ADT.<br />
As described above <strong>the</strong> mileage for heavy duty vehicles is upscaled <strong>to</strong> fit<br />
<strong>the</strong> national <strong>to</strong>tal fuel consumption, which leads <strong>to</strong> <strong>the</strong> assumption that<br />
more heavy traffic occurs on mo<strong>to</strong>rways than given in <strong>the</strong> NRTD and<br />
<strong>the</strong>reby a larger emission is distributed for heavy duty on highways than<br />
would be <strong>the</strong> case if <strong>the</strong> <strong>emissions</strong> were calculated from <strong>the</strong> ADT in<br />
NRTD. Fur<strong>the</strong>r, <strong>the</strong> ADT for passenger cars on rural roads are larger in<br />
NRTD than <strong>the</strong> corresponding mileage in <strong>the</strong> national inven<strong>to</strong>ry. This<br />
25
26<br />
leads <strong>to</strong> a smaller emission being allocated on rural roads than if <strong>the</strong><br />
<strong>emissions</strong> were calculated from <strong>the</strong> ADT in NRTD. The different approaches<br />
in <strong>the</strong> Danish inven<strong>to</strong>ry system and in NRTD taken in<strong>to</strong> account<br />
ADT and mileage are very much alike.<br />
Figure 3.4 Emission <strong>of</strong> NOx from road transport in 2008. Green and blue areas are land and sea areas without <strong>emissions</strong>.<br />
0LOLWDU\<br />
Emissions from military include road and <strong>of</strong>f-road transport, navigation,<br />
aviation and use <strong>of</strong> machinery for military purpose. The <strong>emissions</strong> are<br />
distributed evenly on <strong>the</strong> Danish military exercise areas given by <strong>the</strong><br />
Danish Forest and Nature Agency as no fur<strong>the</strong>r data are available but<br />
<strong>the</strong> <strong>to</strong>tal fuel consumption. The share <strong>of</strong> <strong>the</strong> 1x1 km grid cells being covered<br />
by military exercise areas are found via intersection in GIS, and <strong>the</strong><br />
<strong>emissions</strong> are distributed according <strong>to</strong> <strong>the</strong> share <strong>of</strong> <strong>the</strong> <strong>to</strong>tal military exercise<br />
area in each 1x1 km gird cell. The methodology has not been<br />
changed since <strong>the</strong> 2007 reporting for CLRTAP (Jensen et al., 2008a).<br />
5DLOZD\V<br />
Emissions from railways are distributed evenly on <strong>the</strong> Danish rail network<br />
as given in KORT 10 from <strong>the</strong> National Survey and Cadastre. The<br />
length <strong>of</strong> railways in each 1x1 km grid cell is used for <strong>distribution</strong> <strong>of</strong> <strong>the</strong><br />
national railway <strong>emissions</strong>. The methodology has not been changed<br />
since <strong>the</strong> 2007 reporting for CLRTAP (Jensen et al., 2008a).<br />
1DYLJDWLRQ<br />
Navigation is divided in<strong>to</strong> two main categories;
• Inland waterways, which covers pleasure crafts.<br />
• Maritime activities, which covers national sea traffic (ferries) and national<br />
fishing.<br />
The six major ferry services Sjællands Odde - Aarhus, Sjællands Odde -<br />
Ebelt<strong>of</strong>t, Kalundborg - Aarhus, Køge - Rønne, Kalundborg - Samsø and<br />
Tårs – Spodsberg are treated separately and <strong>emissions</strong> are calculated according<br />
<strong>to</strong> <strong>the</strong> number <strong>of</strong> trips, fuel consumption and engine information<br />
for <strong>the</strong> ferries. The routes used for spatial <strong>distribution</strong> <strong>of</strong> <strong>the</strong> <strong>emissions</strong><br />
are straight lines between <strong>the</strong> harbours and <strong>the</strong> <strong>emissions</strong> are distributed<br />
evenly on <strong>the</strong> routes. The major ferry services are shown in Figure 3.5.<br />
Figure 3.5 Major ferry and flight routes used for <strong>distribution</strong> <strong>of</strong> <strong>emissions</strong> in <strong>SPREAD</strong>.<br />
Emissions from <strong>the</strong> remaining ferries and o<strong>the</strong>r navigation are distributed<br />
evenly on <strong>the</strong> Danish sea terri<strong>to</strong>ry like <strong>the</strong> approach in <strong>the</strong> 2007 reporting<br />
for CLRTAP (Jensen et al., 2008).<br />
$YLDWLRQ<br />
Aviation is divided in<strong>to</strong> three categories; Domestic LTO, International<br />
LTO and domestic cruise. LTO refers <strong>to</strong> Landing and Take Off and is defined<br />
as activities below 1000 m. Cruise refers <strong>to</strong> flights above 1000 m.<br />
Emissions from domestic cruise are calculated separately for nine major<br />
routes according <strong>to</strong> number <strong>of</strong> trips, fuel consumption and information<br />
on <strong>the</strong> flights and planes. The methodology from <strong>the</strong> 2007 reporting for<br />
CLRTAP has been applied in <strong>SPREAD</strong> (Jensen et al., 2008). The nine major<br />
routes are defined as a straight line between Denmark’s largest <strong>air</strong>port<br />
Copenhagen Airport Kastrup and <strong>the</strong> nine following <strong>air</strong>ports; Aalborg,<br />
Karup, Billund, Tirstrup, Rønne, Sønderborg, Odense, Esbjerg and<br />
Copenhagen Airport Roskilde (Figure 3.5). The <strong>emissions</strong> are distributed<br />
27
28<br />
on route network created as straight lines between <strong>the</strong> <strong>air</strong>ports. Emissions<br />
from <strong>the</strong> remaining routes are added <strong>to</strong> <strong>the</strong> nine major routes using<br />
<strong>the</strong> same <strong>distribution</strong>. The nine major routes accounts for 57 % <strong>of</strong> <strong>the</strong> <strong>to</strong>tal<br />
fuel consumption for domestic cruise in 2008. The remaining 43 % include<br />
o<strong>the</strong>r routes, mainly <strong>to</strong> Greenland and Faroe Islands and routes<br />
performed by private/taxi flights.<br />
The largest <strong>air</strong>port in Denmark is Copenhagen Airport, Kastrup (EKCH).<br />
In <strong>the</strong> national inven<strong>to</strong>ry EKCH is treated as a Large Point Source (LPS),<br />
both concerning LTO and cruise. In <strong>SPREAD</strong> domestic cruise from<br />
EKCH is treated as an area source and distributed on <strong>the</strong> route network,<br />
while <strong>emissions</strong> from LTO are located at <strong>the</strong> position <strong>of</strong> EKCH.<br />
The same background data are used for calculation <strong>of</strong> <strong>emissions</strong> from<br />
LTO. Emissions from domestic and international LTO at Copenhagen<br />
Airport Kastrup are allocated on <strong>the</strong> site (point) included in <strong>the</strong> Danish<br />
inven<strong>to</strong>ry system. The remaining <strong>emissions</strong> from LTO are distributed on<br />
<strong>the</strong> nine major <strong>air</strong>ports according <strong>to</strong> <strong>the</strong> <strong>air</strong>port areas given in KORT10<br />
by <strong>the</strong> National Survey and Cadastre. LTO for <strong>the</strong> 10 major <strong>air</strong>ports accounts<br />
for 82 % <strong>of</strong> <strong>the</strong> national fuel consumption for LTO in 2008.<br />
$JULFXOWXUH )RUHVWU\ ,QGXVWU\ +RXVHKROG JDUGHQLQJ<br />
The <strong>emissions</strong> from <strong>the</strong> national emission inven<strong>to</strong>ry for mobile sources<br />
in Forestry, Industry as well as Household and gardening are distributed<br />
according <strong>to</strong> land use maps in KORT10 by <strong>the</strong> National Survey and Cadastre.<br />
The category “low settlements” are used as <strong>distribution</strong> key for<br />
Household & gardening. Emissions from mobile sources in Agriculture<br />
are distributed on <strong>the</strong> Danish agricultural area from <strong>the</strong> field block map.<br />
5HVXOWV IRU PRELOH VRXUFHV<br />
Emissions <strong>of</strong> NOx from o<strong>the</strong>r mobile sources (excluding road traffic) are<br />
dominated by <strong>the</strong> major aviation and navigation routes and <strong>the</strong> railway<br />
network (Figure 3.6). Also <strong>the</strong> military exercise areas are clear on <strong>the</strong><br />
map. Only very few and relatively small areas have no <strong>emissions</strong> from<br />
o<strong>the</strong>r mobile sources. Emissions on <strong>the</strong> national sea terri<strong>to</strong>ry occur because<br />
<strong>emissions</strong> from navigation o<strong>the</strong>r than <strong>the</strong> major ferry routes are<br />
distributed evenly on <strong>the</strong> national sea area. On land <strong>emissions</strong> are allocated<br />
<strong>to</strong> areas <strong>of</strong> agriculture, forest, industry and low buildings, which<br />
by far cover <strong>the</strong> major part <strong>of</strong> <strong>the</strong> Danish land area.
Figure 3.6 Emission <strong>of</strong> NOx from O<strong>the</strong>r Mobile Sources (excluding road traffic) in 2008.<br />
)XJLWLYH (PLVVLRQV IURP )XHOV<br />
This sub-sec<strong>to</strong>r covers <strong>emissions</strong> from exploration, transport, processing<br />
and s<strong>to</strong>rage <strong>of</strong> solid, gaseous and liquid fuels. The spatial <strong>distribution</strong> is<br />
carried out separately for each source listed in Table 3.6, including SNAP<br />
codes and <strong>the</strong> relevant pollutants.<br />
29
30<br />
Table 3.6 Sources and pollutants included in <strong>the</strong> inven<strong>to</strong>ry <strong>of</strong> fugitive <strong>emissions</strong> from<br />
fuels.<br />
Source SNAP<br />
code<br />
Note<br />
S<strong>to</strong>rage <strong>of</strong> coal 050103 TSP, PM10 and PM2.5<br />
Extraction <strong>of</strong> oil and natural gas 050202 NMVOC and CH4.<br />
Flaring <strong>of</strong>fshore 090206 All pollutants except HCB<br />
Offshore loading <strong>of</strong> ships 050202 NMVOC and CH4.<br />
Onshore loading <strong>of</strong> ships 050201 NMVOC and CH4.<br />
Oil transport in pipeline and<br />
s<strong>to</strong>rage at <strong>the</strong> raw oil terminal<br />
050201 NMVOC and CH4.<br />
Service stations 050503 NMVOC<br />
Transmission <strong>of</strong> natural gas 050601 NMVOC and CH4.<br />
Distribution <strong>of</strong> natural gas 050603 NMVOC and CH4.<br />
Distribution <strong>of</strong> <strong>to</strong>wn gas 050603-<br />
F02<br />
NMVOC and CH4.<br />
Gas s<strong>to</strong>rage plants 090206 All pollutants except HCB.<br />
Gas treatment plants 050601, NMVOC, CH4 for SNAP 050601. All<br />
090206 pollutants except HCB for SNAP 090206.<br />
Refineries 040101, NMVOC and CH4 for SNAP 040101. SO2<br />
040103, for SNAP 040103. All pollutants except<br />
090203<br />
HCB for SNAP 090203.<br />
6ROLG IXHOV<br />
Fugitive <strong>emissions</strong> from solid fuels in <strong>the</strong> Danish inven<strong>to</strong>ry cover s<strong>to</strong>rage<br />
<strong>of</strong> coal in coal piles and include <strong>emissions</strong> <strong>of</strong> particulate matter (TPS,<br />
PM10 and PM2.5). Coal piles appear on coal harbours and at coal fired<br />
CHP plants. Most <strong>of</strong> <strong>the</strong> coal fired CHP plants are located at or near <strong>the</strong><br />
harbours. 50 % <strong>of</strong> <strong>the</strong> emission from coal s<strong>to</strong>rage is distributed on coal<br />
harbours and 50 % on coal fired CHP plants. Fur<strong>the</strong>r, <strong>the</strong> <strong>emissions</strong> are<br />
distributed according <strong>to</strong> <strong>the</strong> unloaded amounts for harbours and <strong>the</strong> consumed<br />
amount for CHP plants.<br />
([WUDFWLRQ RI RLO DQG QDWXUDO JDV<br />
This category includes <strong>emissions</strong> from extraction <strong>of</strong> oil and natural gas<br />
by <strong>the</strong> Danish opera<strong>to</strong>rs on <strong>the</strong> North Sea. The inven<strong>to</strong>ry includes <strong>emissions</strong><br />
<strong>of</strong> NMVOC and CH4. Emissions from extraction are distributed on<br />
<strong>the</strong> <strong>of</strong>fshore installations with production weighted by <strong>the</strong> produced<br />
amounts <strong>of</strong> natural gas, as <strong>the</strong> produced amounts <strong>of</strong> natural gas is far<br />
more influential on <strong>the</strong> <strong>emissions</strong> from extraction than produced<br />
amounts <strong>of</strong> oil.<br />
2IIVKRUH IODULQJ<br />
Offshore flaring covers burning <strong>of</strong> gas for technical or safety reasons on<br />
<strong>the</strong> <strong>of</strong>fshore installations in relation <strong>to</strong> extraction activities. Emissions<br />
from flaring include all pollutants except HCB, which are assumed not<br />
applicable in <strong>the</strong> EMEP/EEA Guidebook (2009). Data on <strong>of</strong>fshore flaring<br />
is available for <strong>the</strong> fields and <strong>the</strong> <strong>emissions</strong> are distributed on <strong>the</strong> installations<br />
with flaring for each field.
2IIVKRUH ORDGLQJ<br />
Offshore loading takes place on two installations and <strong>the</strong> <strong>emissions</strong> are<br />
distributed according <strong>to</strong> <strong>the</strong> oil production at <strong>the</strong> two installations.<br />
3LSHOLQH RLO<br />
Raw oil extracted on <strong>the</strong> North Sea is transported <strong>to</strong> s<strong>to</strong>rage tanks at <strong>the</strong><br />
Danish onshore raw oil terminal via a sea and land pipeline. The emission<br />
is by far dominated by <strong>emissions</strong> from s<strong>to</strong>rage tanks while <strong>emissions</strong><br />
from transport through <strong>the</strong> pipeline are assumed <strong>to</strong> be negligible.<br />
Emissions from <strong>the</strong> oil terminal include NMVOC and CH4 and all <strong>emissions</strong><br />
are located at <strong>the</strong> site for <strong>the</strong> raw oil terminal in <strong>SPREAD</strong>.<br />
6HUYLFH VWDWLRQV<br />
The source called service stations includes unloading <strong>of</strong> tanker trucks,<br />
s<strong>to</strong>rage in tanks at <strong>the</strong> service stations and refuelling <strong>of</strong> vehicles. Emissions<br />
<strong>of</strong> NMVOC are calculated according <strong>to</strong> <strong>the</strong> gasoline sales for consumption<br />
for a number <strong>of</strong> uses i.a. road traffic, households, industries,<br />
navigation, aviation and agriculture. Even though a number <strong>of</strong> small industrial<br />
and private gasoline tanks occur, <strong>the</strong> major part <strong>of</strong> <strong>the</strong> gasoline<br />
is sold from service stations. A dataset including location <strong>of</strong> 2 260 service<br />
stations in Denmark from <strong>the</strong> Danish Petroleum Association are used for<br />
<strong>distribution</strong> <strong>of</strong> <strong>emissions</strong> from service stations. As <strong>the</strong> dataset does not<br />
include information on annual gasoline amounts <strong>the</strong> <strong>emissions</strong> are distributed<br />
evenly between <strong>the</strong> service stations. The methodology for service<br />
stations are adopted from <strong>the</strong> 2007 reporting for CLRTAP (Jensen et<br />
al., 2008a) as <strong>the</strong> list <strong>of</strong> service stations from <strong>the</strong> Danish Petroleum Association<br />
has not been updated in <strong>the</strong> meantime.<br />
7UDQVPLVVLRQ RI QDWXUDO JDV<br />
The Danish gas transmission network is owned and run by <strong>the</strong> transmission<br />
company Energinet.dk who has delivered spatial data on <strong>the</strong> location<br />
<strong>of</strong> <strong>the</strong> measurement and regula<strong>to</strong>r stations (M/R stations). The<br />
transmission network is made <strong>of</strong> plastic, which results in only minimal<br />
fugitive losses. However, <strong>the</strong> pipes are vulnerable and <strong>the</strong> major part <strong>of</strong><br />
<strong>the</strong> fugitive <strong>emissions</strong> owe <strong>to</strong> excavations and construction work. Venting<br />
due <strong>to</strong> damages and maintenance work are measured or estimated in<br />
each case. Fur<strong>the</strong>r, <strong>emissions</strong> occur at <strong>the</strong> M/R stations. Emissions <strong>of</strong><br />
NMVOC and CH4 from transmission <strong>of</strong> natural gas are distributed<br />
evenly on <strong>the</strong> 72 M/R stations as data on single venting situations is not<br />
available. The methodology for transmission <strong>of</strong> natural gas is adopted<br />
from <strong>the</strong> 2007 reporting for CLRTAP (Jensen et al., 2008).<br />
'LVWULEXWLRQ RI QDWXUDO JDV<br />
Three companies carry out <strong>distribution</strong> <strong>of</strong> natural gas and <strong>the</strong> network<br />
covers a large part <strong>of</strong> <strong>the</strong> Danish land area (Figure 3.7). As <strong>the</strong> location <strong>of</strong><br />
<strong>the</strong> network is not known and <strong>the</strong> <strong>distribution</strong> amounts are only available<br />
as annual sums for each company <strong>the</strong> spatial <strong>distribution</strong> is carried<br />
out according <strong>to</strong> information in <strong>the</strong> Regional Inven<strong>to</strong>ry by <strong>the</strong> Danish<br />
Energy Agency. The Regional Inven<strong>to</strong>ry holds fuel consumptions <strong>of</strong><br />
natural gas on SNAP 2 and municipality level. The <strong>emissions</strong> <strong>of</strong> NMVOC<br />
and CH4 are distributed according <strong>to</strong> <strong>the</strong> Regional Inven<strong>to</strong>ry and are fur-<br />
31
32<br />
<strong>the</strong>r distributed on <strong>the</strong> grid cells in each municipality according <strong>to</strong> <strong>the</strong><br />
grid cells share <strong>of</strong> <strong>the</strong> <strong>to</strong>tal municipality area determined by intersection<br />
<strong>of</strong> a municipality map and <strong>the</strong> Danish 1x1 km grid in GIS.<br />
Figure 3.7 Distribution <strong>of</strong> natural gas in Denmark. Green areas have no gas <strong>distribution</strong>.<br />
'LVWULEXWLRQ RI WRZQ JDV<br />
Town gas is distributed in two Danish cities, Copenhagen and Aalborg.<br />
As maps <strong>of</strong> <strong>the</strong> entire <strong>distribution</strong> network are not available <strong>the</strong> same<br />
approach is used for spatial <strong>distribution</strong> for <strong>to</strong>wn gas <strong>distribution</strong> as for<br />
<strong>distribution</strong> <strong>of</strong> natural gas, but only for <strong>the</strong> two relevant municipalities.<br />
The inven<strong>to</strong>ry includes NMVOC and CH4 <strong>emissions</strong> from <strong>to</strong>wn gas <strong>distribution</strong>.<br />
2LO UHILQLQJ<br />
Denmark has two refineries, which are treated as large point sources in<br />
<strong>the</strong> Danish inven<strong>to</strong>ry system. The inven<strong>to</strong>ry covers <strong>emissions</strong> <strong>of</strong> SO2,<br />
NMVOC and CH4 from petroleum product processing including fugitive<br />
<strong>emissions</strong> from valves and s<strong>to</strong>rage tanks, <strong>emissions</strong> <strong>of</strong> SO2 from sulphur<br />
recovery at one refinery and <strong>emissions</strong> <strong>of</strong> all pollutants except HCB for<br />
flaring in refineries. Emissions are available for <strong>the</strong> refineries separately<br />
and are located at <strong>the</strong> geographical position registered in <strong>the</strong> inven<strong>to</strong>ry<br />
database.<br />
*DV SODQWV<br />
Natural gas extracted on <strong>the</strong> North Sea is lead <strong>to</strong> <strong>the</strong> gas treatment plant.<br />
Part <strong>of</strong> <strong>the</strong> natural gas is s<strong>to</strong>red in <strong>the</strong> two Danish gas s<strong>to</strong>rage plants. All
three plants are treated as LPS in <strong>the</strong> inven<strong>to</strong>ry system and <strong>the</strong> <strong>emissions</strong><br />
are allocated on <strong>the</strong> site <strong>of</strong> <strong>the</strong> plants in <strong>SPREAD</strong>. The inven<strong>to</strong>ry covers<br />
venting and flaring in <strong>the</strong> gas treatment and s<strong>to</strong>rage plants and includes<br />
all pollutants excluding HCB.<br />
5HVXOWV IRU IXJLWLYH HPLVVLRQV IURP IXHOV<br />
Fugitive NMVOC <strong>emissions</strong> from fuels are shown in Figure 3.8. A few<br />
grid cells have large <strong>emissions</strong> due <strong>to</strong> <strong>the</strong> presence <strong>of</strong> point sources both<br />
onshore and <strong>of</strong>fshore. Among <strong>the</strong> most important point sources are <strong>the</strong><br />
raw oil terminal and <strong>the</strong> refineries onshore and <strong>the</strong> extraction and flaring<br />
sites <strong>of</strong>fshore. Green areas have no <strong>emissions</strong>. This is mainly due <strong>to</strong> no<br />
<strong>distribution</strong> <strong>of</strong> natural gas, which is given on municipality level. Areas<br />
without <strong>emissions</strong> do <strong>the</strong>refore correspond <strong>to</strong> <strong>the</strong> municipality without<br />
natural gas <strong>distribution</strong>. Please notice that a number <strong>of</strong> separate grid<br />
cells in all parts <strong>of</strong> Denmark have <strong>emissions</strong> due <strong>to</strong> <strong>the</strong> presence <strong>of</strong> service<br />
stations as shown in <strong>the</strong> enlarged part <strong>of</strong> Figure 3.8.<br />
Figure 3.8 Fugitive emission <strong>of</strong> NMVOC in 2008. Green and blue areas are land and sea areas without <strong>emissions</strong>. The<br />
square in <strong>the</strong> upper right corner shows an enlargement <strong>of</strong> <strong>the</strong> Funen area where <strong>the</strong> <strong>emissions</strong> in separate grid cells are<br />
visible.<br />
33
34<br />
6SDWLDO GLVWULEXWLRQ RI HPLVVLRQV IURP<br />
,QGXVWULDO 3URFHVVHV<br />
Industrial processes cover a number <strong>of</strong> industries in <strong>the</strong> Danish emission<br />
inven<strong>to</strong>ry. The major companies are treated as large point sources in <strong>the</strong><br />
Danish inven<strong>to</strong>ry system and <strong>the</strong> <strong>emissions</strong> are ei<strong>the</strong>r calculated from<br />
plant specific data or provided directly by <strong>the</strong> company. The LPSs cover<br />
processes in inorganic and organic chemical industries and processes in<br />
wood, paper, pulp, food and drink and o<strong>the</strong>r industries. The inven<strong>to</strong>ry<br />
<strong>of</strong> industrial processes include <strong>emissions</strong> <strong>of</strong> SO2, NOx, NMVOC, CH4,<br />
CO, CO2, NH3, TSP, PM10, PM2.5, Cd, Cu, Pb, Zn and dioxin.<br />
The most important industries in <strong>the</strong> Danish emission inven<strong>to</strong>ry are<br />
processes in wood, paper pulp, food, drink and o<strong>the</strong>r industries according<br />
<strong>to</strong> <strong>emissions</strong> <strong>of</strong> NMVOC and production <strong>of</strong> cement (decarbonising)<br />
according <strong>to</strong> <strong>emissions</strong> <strong>of</strong> CO2. Emissions <strong>of</strong> o<strong>the</strong>r pollutants are relatively<br />
small compared <strong>to</strong> <strong>the</strong> national <strong>emissions</strong>.<br />
It is only <strong>the</strong> minority <strong>of</strong> <strong>the</strong> industries that are represented in <strong>the</strong> LPS<br />
part <strong>of</strong> <strong>the</strong> emission inven<strong>to</strong>ry. The rest <strong>of</strong> <strong>the</strong> industries are treated as<br />
area sources and are incorporated in <strong>the</strong> inven<strong>to</strong>ry by use <strong>of</strong> production<br />
statistics. Emissions from industrial processes from area sources are distributed<br />
equally on <strong>the</strong> Danish industrial area as given in KORT10 by <strong>the</strong><br />
National Survey and Cadastre. The <strong>SPREAD</strong> methodology corresponds<br />
<strong>the</strong> methodology in <strong>the</strong> 2007 reporting for CLRTAP (Jensen et al., 2008).<br />
5HVXOWV IRU LQGXVWULDO SURFHVVHV<br />
Emissions from industrial processes are distributed according <strong>to</strong> <strong>the</strong> industrial<br />
area and <strong>the</strong> <strong>emissions</strong> in <strong>the</strong> cell depend on <strong>the</strong> share <strong>of</strong> <strong>the</strong> grid<br />
cell intersecting, <strong>the</strong> industrial areas and <strong>the</strong> <strong>to</strong>tal emission. Only exception<br />
is <strong>emissions</strong> from industrial LPSs, which are for <strong>the</strong> major part located<br />
in <strong>the</strong> industrial areas. The resulting emission <strong>distribution</strong> for industrial<br />
processes is shown in Figure 4.1.
Figure 4.1 NMVOC from Industrial Processes in 2008. Green and blue areas are land and sea areas without <strong>emissions</strong>.<br />
35
36<br />
6SDWLDO GLVWULEXWLRQ RI HPLVVLRQV IURP<br />
6ROYHQWV DQG RWKHU SURGXFW XVH<br />
The inven<strong>to</strong>ry for solvents and o<strong>the</strong>r product use covers 38 categories<br />
based on industry and use. The sec<strong>to</strong>r includes <strong>emissions</strong> <strong>of</strong> NMVOC,<br />
CO2 and N2O. All sources in <strong>the</strong> sec<strong>to</strong>r are treated as area sources as no<br />
data on <strong>the</strong> geographical location is available. For spatial <strong>distribution</strong><br />
three <strong>distribution</strong> keys have been applied based on location <strong>of</strong> industrial<br />
areas, <strong>of</strong> low settlements and <strong>of</strong> <strong>the</strong> population. Industrial areas and low<br />
settlements are based on KORT 10 from <strong>the</strong> National Survey and Cadastre.<br />
Data from <strong>the</strong> Civil Registration System (CPR) is used <strong>to</strong> set up a <strong>distribution</strong><br />
key for <strong>the</strong> population at <strong>the</strong> 1x1 km grid. The categories and<br />
<strong>the</strong> corresponding <strong>distribution</strong> keys are listed in Table 5.1.<br />
CO2 <strong>emissions</strong> in <strong>the</strong> inven<strong>to</strong>ry for solvents and o<strong>the</strong>r product use refer<br />
<strong>to</strong> secondary CO2 from NMVOC. In <strong>SPREAD</strong> it is assumed that <strong>the</strong> <strong>emissions</strong><br />
<strong>of</strong> NMVOC and CO2 are located at <strong>the</strong> same site.
Table 5.1 Emission sources and <strong>distribution</strong> keys for solvents and o<strong>the</strong>r product use.<br />
Distribution key SNAP Source (SNAP 2 level) Source (SNAP 3 level)<br />
Industry 60101 Paint application Manufacture <strong>of</strong> Au<strong>to</strong>mobiles<br />
Industry 60102 Paint application Car Rep<strong>air</strong>ing<br />
Low settlements 60103 Paint application Constructions and Buildings<br />
Population 60104 Paint application Domestic Use<br />
Industry 60105 Paint application Coil Coating<br />
Industry 60106 Paint application Boat Building<br />
Population 60107 Paint application Wood<br />
Industry 60108 Paint application O<strong>the</strong>r Industrial Paint Applications<br />
Population 60109 Paint application O<strong>the</strong>r Non-Industrial Paint Application<br />
Industry 60201 Degreasing, dry cleaning and electronics Metal Degreasing<br />
Low settlements 60202 Degreasing, dry cleaning and electronics Dry Cleaning<br />
Industry 60203 Degreasing, dry cleaning and electronics Electronic Components Manufacturing<br />
Industry 60204 Degreasing, dry cleaning and electronics O<strong>the</strong>r Industrial Dry Cleaning<br />
Industry 60301 Chemical products manufacturing or processing Polyester Processing<br />
Industry 60302 Chemical products manufacturing or processing Polyvinylchlorid Processing<br />
Industry 60303 Chemical products manufacturing or processing Polyurethan Foam Processing<br />
Industry 60304 Chemical products manufacturing or processing Polystyrene Foam Processing<br />
Industry 60305 Chemical products manufacturing or processing Rubber Processing<br />
Industry 60306 Chemical products manufacturing or processing Pharmaceuticals Products Manufacturing<br />
Industry 60307 Chemical products manufacturing or processing Paints Manufacturing<br />
Industry 60308 Chemical products manufacturing or processing Inks Manufacturing<br />
Industry 60309 Chemical products manufacturing or processing Glues Manufacturing<br />
Population 60310 Chemical products manufacturing or processing Asphalt Blowing<br />
Industry 60311 Chemical products manufacturing or processing Adhesive, Magnetic Tapes, Film & Pho<strong>to</strong>graphs<br />
Manufacturing<br />
Industry 60312 Chemical products manufacturing or processing Textile Finishing<br />
Industry 60313 Chemical products manufacturing or processing Lea<strong>the</strong>r Tanning<br />
Industry 60314 Chemical products manufacturing or processing O<strong>the</strong>r<br />
Industry 60401 O<strong>the</strong>r use <strong>of</strong> solvents and related activities Glass Wool Enduction<br />
Industry 60402 O<strong>the</strong>r use <strong>of</strong> solvents and related activities Mineral Wool Enduction<br />
Industry 60403 O<strong>the</strong>r use <strong>of</strong> solvents and related activities Printing Industry<br />
Industry 60404 O<strong>the</strong>r use <strong>of</strong> solvents and related activities Fat, Edible and Non-Edible Oil Extraction<br />
Industry 60405 O<strong>the</strong>r use <strong>of</strong> solvents and related activities Application <strong>of</strong> Glues and Adhesives<br />
Population 60406 O<strong>the</strong>r use <strong>of</strong> solvents and related activities Preservation <strong>of</strong> Wood<br />
Industry 60407 O<strong>the</strong>r use <strong>of</strong> solvents and related activities Underseal Treatment and Conservation <strong>of</strong> Vehicles<br />
Population 60408 O<strong>the</strong>r use <strong>of</strong> solvents and related activities Domestic Solvent Use (O<strong>the</strong>r Than Paint Application)<br />
Industry 60409 O<strong>the</strong>r use <strong>of</strong> solvents and related activities Vehicles Dewaxing<br />
Population 60411 O<strong>the</strong>r use <strong>of</strong> solvents and related activities Domestic Use <strong>of</strong> Pharmaceutical Products<br />
Industry 60412 O<strong>the</strong>r use <strong>of</strong> solvents and related activities O<strong>the</strong>r (Preservation <strong>of</strong> Seeds)<br />
5HVXOWV IRU VROYHQWV DQG RWKHU SURGXFW XVH<br />
Emissions from solvents and o<strong>the</strong>r product use are allocated on <strong>the</strong> major<br />
part <strong>of</strong> <strong>the</strong> Danish land area as <strong>the</strong> <strong>distribution</strong> is based on industrial<br />
areas, areas with low settlements and <strong>the</strong> location <strong>of</strong> <strong>the</strong> population, <strong>the</strong><br />
latter covering by far <strong>the</strong> largest area. Also densely populated areas<br />
stand out with large <strong>emissions</strong>. Areas without <strong>emissions</strong> have no popu-<br />
37
38<br />
lation and are mainly agricultural areas and natural areas, e.g. lakes, dunes<br />
and moor (Figure 5.1).<br />
Figure 5.1 Emissions <strong>of</strong> NMVOC from solvents and o<strong>the</strong>r product use in 2008. Green and blue areas are land and sea<br />
areas without <strong>emissions</strong>.
6SDWLDO GLVWULEXWLRQ RI HPLVVLRQV IURP<br />
WKH $JULFXOWXUDO VHFWRU<br />
The Danish emission inven<strong>to</strong>ry for <strong>the</strong> agricultural sec<strong>to</strong>r covers five<br />
sub-sec<strong>to</strong>rs:<br />
1. Enteric fermentation, which covers <strong>emissions</strong> <strong>of</strong> CH4 from animals’<br />
digestion.<br />
2. Manure management, which covers <strong>emissions</strong> <strong>of</strong> CH4, N2O, NH3 and<br />
PM from handling <strong>of</strong> manure in housings and during s<strong>to</strong>rage in<br />
slurry tanks and manure heaps.<br />
3. Agricultural soils, which cover <strong>emissions</strong> <strong>of</strong> N2O from crop residues,<br />
N fixing crops, animal manure applied <strong>to</strong> soils, syn<strong>the</strong>tic fertiliser,<br />
leaching and run-<strong>of</strong>f, atmospheric deposition, N-excretion on pasture<br />
range and paddock, cultivation <strong>of</strong> his<strong>to</strong>sols and sludge applied <strong>to</strong><br />
soils. Fur<strong>the</strong>r, agricultural soils cover NMVOC and NH3 from crops.<br />
4. Field burning <strong>of</strong> agricultural residues covers <strong>emissions</strong> <strong>of</strong> all pollutants<br />
from field burning in <strong>the</strong> inven<strong>to</strong>ry system except CO2 as this is<br />
treated as biomass and HCB, which are not occurring.<br />
5. O<strong>the</strong>r covers NH3 from sludge (including e.g. fruit juice and pota<strong>to</strong><br />
juice e.g. from pota<strong>to</strong> flour plants). As <strong>the</strong> categorisation is different<br />
for UNFCCC and CLRTAP, emission from sludge is included in different<br />
categories in <strong>the</strong> two reporting formats; in Agricultural soils<br />
for UNFCCC and in O<strong>the</strong>r for CLRTAP. Prior <strong>to</strong> 2008 NH3 from<br />
sludge was allocated in <strong>the</strong> agricultural soils sub-sec<strong>to</strong>r in both reporting<br />
formats, but due <strong>to</strong> a shift <strong>to</strong> <strong>the</strong> new NFR categories from<br />
<strong>the</strong> 2008 reporting, <strong>the</strong> shift in sub-category was carried out.<br />
The emission inven<strong>to</strong>ry for <strong>the</strong> agricultural sec<strong>to</strong>r is using detailed methodologies<br />
and a large number <strong>of</strong> very detailed datasets, e.g. figures from<br />
Statistics Denmark, feedstuffs tables, normative feed consumption and<br />
nitrogen excretion figures, and data from <strong>the</strong> Central Husbandry Register<br />
(CHR) and <strong>the</strong> General Agriculture Register (GLR). The emission calculation<br />
is taking in<strong>to</strong> account a number <strong>of</strong> conditions related <strong>to</strong> e.g.<br />
animals, housings, manure management, litter, fodder, crops, use <strong>of</strong> fertiliser<br />
and sludge.<br />
The spatial <strong>distribution</strong> <strong>of</strong> <strong>emissions</strong> from agriculture is carried out separately<br />
for each source. The <strong>distribution</strong>s are based on a large amount <strong>of</strong><br />
very detailed data, e.g. <strong>the</strong> CHR, GLR, <strong>the</strong> Land Parcel Identification System<br />
(LPIS) and <strong>the</strong> nitrogen accounts for each individual farmer. CHR<br />
holds information on <strong>the</strong> population and location <strong>of</strong> animals on a large<br />
number <strong>of</strong> animal-categories. GLR holds data on types <strong>of</strong> crops on field<br />
and farm level. LPIS hold <strong>the</strong> geographical location <strong>of</strong> all Danish agricultural<br />
soils. The land parcels are split by natural boundaries in <strong>the</strong> landscape,<br />
e.g. trenches, hedgerows and roads. Although one land parcels<br />
can cover one or more fields this dataset combined with GLR and CHR<br />
gives very detailed information on <strong>the</strong> location <strong>of</strong> fields, crops and animals.<br />
On average one land parcels covers approximately 11 hectares and<br />
includes three fields.<br />
39
40<br />
As lined out <strong>the</strong> agricultural sec<strong>to</strong>r covers a number <strong>of</strong> sources, which<br />
are distributed according <strong>to</strong> different spatial keys. Emissions from <strong>the</strong><br />
agricultural sources are calculated with a bot<strong>to</strong>m-up approach for <strong>the</strong><br />
spatial <strong>distribution</strong>. The bot<strong>to</strong>m-up calculation is carried out on a<br />
100x100 m grid, which is aggregated in<strong>to</strong> a 1x1 km grid in <strong>SPREAD</strong>.<br />
The <strong>emissions</strong> estimated by <strong>the</strong> bot<strong>to</strong>m-up approach are not completely<br />
consistent with <strong>the</strong> <strong>emissions</strong> in <strong>the</strong> national inven<strong>to</strong>ry, which are calculated<br />
with a <strong>to</strong>p-down approach as <strong>the</strong> emission calculation must be consistent<br />
with <strong>the</strong> national statistics. In order <strong>to</strong> ensure that <strong>the</strong> <strong>emissions</strong><br />
in <strong>SPREAD</strong> are equal <strong>to</strong> <strong>the</strong> reported <strong>emissions</strong> for 2008, <strong>the</strong> reported<br />
<strong>emissions</strong> are distributed according <strong>to</strong> <strong>the</strong> <strong>distribution</strong> keys set up by <strong>the</strong><br />
bot<strong>to</strong>m-up approach.<br />
(QWHULF )HUPHQWDWLRQ<br />
CH4 from enteric fermentation is distributed according <strong>to</strong> data on <strong>the</strong><br />
number and categories <strong>of</strong> animals on farm level. CHR holds data for <strong>the</strong><br />
majority <strong>of</strong> <strong>the</strong> lives<strong>to</strong>ck covering animal-categories related <strong>to</strong> e.g. breed<br />
and age (e.g. calf, heifer and cow or sow and piglets) and use (e.g. d<strong>air</strong>y<br />
cattle and beef cattle). The horse breeding register holds addresses <strong>of</strong> <strong>the</strong><br />
owners, and this is <strong>the</strong> best dataset for spatial <strong>distribution</strong> <strong>of</strong> <strong>emissions</strong><br />
from horses even though <strong>the</strong> horses might be located at different sites<br />
than <strong>the</strong> owners address. As <strong>the</strong> register for horses does not hold information<br />
on pasture areas, <strong>emissions</strong> from both stables, s<strong>to</strong>rage and grazing<br />
are located at <strong>the</strong> owners address.<br />
0DQXUH 0DQDJHPHQW<br />
The <strong>distribution</strong> <strong>of</strong> CH4, N2O, NH3, TSP, PM10 and PM2.5 from manure<br />
management is based on <strong>the</strong> data from GLR and CHR. As for enteric<br />
fermentation <strong>the</strong> location <strong>of</strong> <strong>the</strong> animals, housing systems and manure<br />
systems is important for <strong>distribution</strong> <strong>of</strong> <strong>emissions</strong> from manure management.<br />
Emissions <strong>of</strong> NH3 from manure management are related <strong>to</strong> activities at<br />
<strong>the</strong> farms and are treated as point sources. Calculations are based on <strong>the</strong><br />
normative figures on N-excretion per farm corrected for grazing. As for<br />
enteric fermentation data <strong>the</strong> horse breeding register is included in <strong>the</strong><br />
calculation.<br />
$JULFXOWXUDO VRLOV<br />
Agricultural soils covers ten sources; crops, application <strong>of</strong> manure, application<br />
<strong>of</strong> syn<strong>the</strong>tic fertiliser, N-excretion on pasture range and paddock,<br />
NH3 treated straw, crop residue, N-fixing crops, cultivation <strong>of</strong> his<strong>to</strong>sols,<br />
leaching and atmospheric deposition. Emissions <strong>of</strong> NMVOC, N2O<br />
and NH3 are included in one or more <strong>of</strong> <strong>the</strong> sources.
&URSV<br />
Calculation <strong>of</strong> NH3 evaporation from crops on agricultural soils are based<br />
on data from GLR, CHR and LPIS data and are carried out for four<br />
crop types; winter seeds, early spring sowed crops, late spring sowed<br />
crops, and grass. The calculated <strong>emissions</strong> are summarised and aggregated<br />
<strong>to</strong> set up a final <strong>distribution</strong> key.<br />
Emissions <strong>of</strong> NMVOC from crops at agricultural fields are included in<br />
<strong>the</strong> emission inven<strong>to</strong>ry. The <strong>distribution</strong> is based on data from GLR on<br />
crop types and <strong>the</strong> LPIS data for location <strong>of</strong> <strong>the</strong> relevant fields.<br />
$SSOLFDWLRQ RI PDQXUH<br />
Application <strong>of</strong> manure on fields causes <strong>emissions</strong> <strong>of</strong> NH3 and N2O. The<br />
<strong>distribution</strong> <strong>model</strong> for NH3 from manure application is based on fertiliser<br />
accountings and <strong>the</strong> LPIS data. The manure produced on each farm<br />
corrected for manure import and export is assumed <strong>to</strong> be distributed<br />
evenly on <strong>the</strong> entire farm fields in rotation even though <strong>the</strong>re might be<br />
some prioritising if <strong>the</strong>re is only a limited amount <strong>of</strong> manure available.<br />
This assumption is applied as no consistent prioritising has been identified.<br />
Fields outside rotation is only given attributes for grazing capacity.<br />
$SSOLFDWLRQ RI IHUWLOLVHU<br />
Use <strong>of</strong> mineral fertilisers causes <strong>emissions</strong> <strong>of</strong> NH3 and N2O. Application<br />
<strong>of</strong> fertiliser is given in <strong>the</strong> fertiliser accountings by amount <strong>of</strong> purchased<br />
N at farm level. The average Danish NH3 emission fac<strong>to</strong>r for mineral fertilise<br />
is used on farm level as <strong>the</strong>re is no data on different types on mineral<br />
fertilisers on farm level. The amount <strong>of</strong> bought mineral fertiliser on<br />
farm level is distributed in<strong>to</strong> each field according <strong>to</strong> each crops recommended<br />
nitrogen application rate for that soil type. No fertiliser is assigned<br />
<strong>to</strong> fields without N-norm, e.g. peas and fallow. Purchased N and<br />
N-norms are compared for <strong>the</strong> farms and a correction fac<strong>to</strong>r has been<br />
applied for <strong>the</strong> N application for farms where <strong>the</strong> purchased amount exceeds<br />
<strong>the</strong> amount calculated from <strong>the</strong> N-norms.<br />
1 H[FUHWLRQ RQ SDVWXUH UDQJH DQG SDGGRFN 353<br />
Emission calculations <strong>of</strong> N2O from animals’ N excretion on pasture range<br />
and paddock are based on average information from <strong>the</strong> Danish Agricultural<br />
Advisory Services, Department for Cattle. The share <strong>of</strong> N-excretion<br />
from cattle is separated between conventional and organic farming as <strong>the</strong><br />
latter has extended periods <strong>of</strong> grazing. Fur<strong>the</strong>r, <strong>the</strong> assumption has been<br />
applied that no grazing occurs in <strong>the</strong> summer period if <strong>the</strong> grass area is<br />
less than 0.15 ha. per d<strong>air</strong>y cattle. This mainly affects <strong>the</strong> farms with a<br />
large number <strong>of</strong> lives<strong>to</strong>ck. As outdoor pigs area are located in CHR <strong>the</strong>se<br />
are also included in <strong>the</strong> calculations and allocated <strong>to</strong> field level as grazing<br />
animals.<br />
1+ WUHDWHG VWUDZ<br />
Use <strong>of</strong> NH3 treated straw has been phased out and is not occurring in <strong>the</strong><br />
2008 inven<strong>to</strong>ry. This source will be included in <strong>the</strong> <strong>model</strong> when applied<br />
for earlier years e.g. in relation <strong>to</strong> reporting in 2012 <strong>of</strong> gridded <strong>emissions</strong><br />
for 2010 and his<strong>to</strong>rical years <strong>to</strong> CLRTAP. The <strong>distribution</strong> key has been<br />
41
42<br />
set up for future use. Emissions <strong>of</strong> NH3 from NH3 treated straw are allocated<br />
<strong>to</strong> conventional d<strong>air</strong>y cattle farms excluding a minor number <strong>of</strong><br />
suckling cattle farms that might use NH3 treated straw.<br />
&URS UHVLGXH<br />
Input data for calculation <strong>of</strong> N2O <strong>emissions</strong> from crop residue is available<br />
in <strong>the</strong> GLR register, which include crop types on field level and<br />
from <strong>the</strong> LPIS data due <strong>to</strong> location <strong>of</strong> <strong>the</strong> fields.<br />
1 IL[LQJ FURSV<br />
Calculation <strong>of</strong> N2O <strong>emissions</strong> from N-fixing crops are based on data<br />
from <strong>the</strong> GLR register on crop types on field level and from <strong>the</strong> LPIS<br />
data where <strong>the</strong> location <strong>of</strong> <strong>the</strong> relevant fields are available.<br />
+LVWRVROV<br />
Distribution <strong>of</strong> N2O from his<strong>to</strong>sols is based on <strong>the</strong> LPIS data in combination<br />
with a map <strong>of</strong> organic soils in <strong>the</strong> soil map based on <strong>the</strong> Danish soil<br />
classification. The emission is distributed evenly on <strong>the</strong> area identified<br />
by intersection <strong>of</strong> <strong>the</strong> field area and <strong>the</strong> organic soil area.<br />
/HDFKLQJ<br />
When <strong>the</strong> fields are fertilised part <strong>of</strong> <strong>the</strong> applied N is not assimilated by<br />
<strong>the</strong> crops. The surplus cause leaching and run-<strong>of</strong>f, which again leads <strong>to</strong><br />
emission <strong>of</strong> N2O. The emission calculations are based on N-content <strong>of</strong> <strong>the</strong><br />
applied fertiliser, manure and sludge. The spatial <strong>distribution</strong> is based<br />
on <strong>the</strong> recommended application rate for each crop from <strong>the</strong> GLR database<br />
in combination with LPIS data. The leaching fac<strong>to</strong>r is assumed <strong>to</strong> be<br />
independent <strong>of</strong> soil type.<br />
$WPRVSKHULF GHSRVLWLRQ<br />
The <strong>distribution</strong> key for emission <strong>of</strong> N2O from NH3 evaporation is estimated<br />
as a sum <strong>of</strong> NH3 from point sources and area sources covering<br />
manure and mineral fertiliser application. This approach is subject <strong>to</strong><br />
some degree <strong>of</strong> inaccuracy as <strong>the</strong> emission <strong>of</strong> N2O takes place at <strong>the</strong> site<br />
for deposition <strong>of</strong> NH3 and not at <strong>the</strong> site for evaporation <strong>of</strong> NH3 as given<br />
in <strong>the</strong> <strong>distribution</strong> key. Introduction <strong>of</strong> a transport <strong>model</strong> <strong>to</strong> make a<br />
deposition map would improve <strong>the</strong> <strong>distribution</strong> key. This has not been<br />
included in <strong>SPREAD</strong>, as <strong>the</strong> available deposition maps include longrange<br />
transboundary NH3, which is not <strong>to</strong> be included in <strong>the</strong> Danish<br />
emission inven<strong>to</strong>ry. Fur<strong>the</strong>r, NH3 from agriculture is not transported<br />
very far before deposition and <strong>the</strong>refore <strong>the</strong> inaccuracy is assumed <strong>to</strong> be<br />
<strong>of</strong> little importance for <strong>the</strong> allocation <strong>of</strong> <strong>the</strong> <strong>emissions</strong>.<br />
All NH3 <strong>emissions</strong> from <strong>the</strong> Danish terri<strong>to</strong>ry are included in <strong>the</strong> <strong>emissions</strong><br />
<strong>distribution</strong> although studies have shown that only part <strong>of</strong> <strong>the</strong><br />
Danish ammonia emission is deposited on <strong>the</strong> Danish area. The Danish<br />
share <strong>of</strong> <strong>the</strong> NH3 deposition on Danish land area is around 36 % and <strong>the</strong><br />
corresponding share for <strong>the</strong> Danish sea area is 14 % (Ellermann et al.<br />
2010.
)LHOG EXUQLQJ RI DJULFXOWXUDO UHVLGXHV<br />
Field burning <strong>of</strong> agricultural residues is very limited in Denmark due <strong>to</strong><br />
a legal prohibition implemented in 1990. The legislation leaves <strong>the</strong> possibility<br />
<strong>of</strong> field burning <strong>of</strong> straw related <strong>to</strong> production <strong>of</strong> some varieties <strong>of</strong><br />
grass seeds and burning <strong>of</strong> wet or broken bales <strong>of</strong> straw. Emissions from<br />
field burning include all pollutants in <strong>the</strong> inven<strong>to</strong>ry system except HCB.<br />
The <strong>distribution</strong> is based on GLR regarding fields with <strong>the</strong> relevant crops<br />
and <strong>the</strong> LPIS data regarding <strong>the</strong> location <strong>of</strong> <strong>the</strong> relevant fields.<br />
2WKHU<br />
The category named O<strong>the</strong>r covers <strong>emissions</strong> <strong>of</strong> N2O from sludge. The<br />
emission is distributed according <strong>to</strong> <strong>the</strong> fertiliser accounts where <strong>the</strong><br />
sludge amounts are given for each farm, GLR where <strong>the</strong> relevant crops<br />
and fields are identified and <strong>the</strong> LPIS data for location <strong>of</strong> <strong>the</strong> fields.<br />
5HVXOWV IRU DJULFXOWXUH<br />
NH3 <strong>emissions</strong> from <strong>the</strong> agricultural sec<strong>to</strong>r cover by far <strong>the</strong> major part <strong>of</strong><br />
Denmark (Figure 6.1). Agricultural soils cover a large part <strong>of</strong> <strong>the</strong> rural<br />
area. Emissions from horses are allocated on <strong>the</strong> addresses <strong>of</strong> <strong>the</strong> owners,<br />
which may lead <strong>to</strong> <strong>emissions</strong> in areas with no agricultural activities and<br />
no animals. Fur<strong>the</strong>r, <strong>the</strong> small number <strong>of</strong> animals present in urban areas<br />
is included, covering poultry in residential areas and grazing animals<br />
e.g. on <strong>the</strong> mounds and common. As expected <strong>the</strong> largest <strong>emissions</strong> are<br />
found in Jutland where many large lives<strong>to</strong>ck are located, as <strong>emissions</strong><br />
from manure management is <strong>the</strong> major source <strong>of</strong> agricultural NH3 in<br />
Denmark.<br />
43
44<br />
Figure 6.1 Emission <strong>of</strong> NH3 from <strong>the</strong> agriculture sec<strong>to</strong>r in 2008. Green and blue areas are land and sea areas without<br />
<strong>emissions</strong>.
6SDWLDO GLVWULEXWLRQ RI HPLVVLRQV IURP<br />
WKH ZDVWH VHFWRU<br />
The waste sec<strong>to</strong>r includes solid waste disposal on land, wastewater<br />
treatment, cremations, incineration <strong>of</strong> carcasses, compost production, accidental<br />
fires and N2O from human sewage. Compost production is included<br />
in <strong>SPREAD</strong> even though it was not implemented in <strong>the</strong> 2008 reporting<br />
for UNFCCC and CLRTAP. All waste incineration in Denmark is<br />
included in <strong>the</strong> heat and power production at CHP plants and waste incineration<br />
plants and <strong>the</strong> <strong>emissions</strong> are included in stationary combustion<br />
in <strong>the</strong> energy sec<strong>to</strong>r.<br />
6ROLG ZDVWH GLVSRVDO<br />
The inven<strong>to</strong>ry for solid waste disposal covers only managed disposal sites<br />
as all solid waste disposal sites in Denmark are managed and includes<br />
<strong>emissions</strong> <strong>of</strong> CH4. The emission calculations are based on data<br />
from <strong>the</strong> ISAG database (InformationsSystem for Affald og Genanvendelse)<br />
hosted by Danish EPA. ISAG holds addresses for waste treatment<br />
companies with processing, incineration, deposition, special treatment<br />
and/or temporary s<strong>to</strong>rage. The ISAG database includes CVR numbers<br />
and addresses for <strong>the</strong> companies and waste amounts in <strong>the</strong> different<br />
categories. The Danish waste <strong>model</strong> estimates <strong>emissions</strong> on a national<br />
basis. The waste composition and <strong>the</strong> corresponding emission vary<br />
widely among <strong>the</strong> waste treatment sites, but as this information is not incorporated<br />
in <strong>the</strong> Danish waste <strong>model</strong>, <strong>the</strong> <strong>emissions</strong> are distributed<br />
evenly on <strong>the</strong> 99 Danish landfill sites.<br />
:DVWHZDWHU WUHDWPHQW<br />
Wastewater treatment occurs at 586 plants and this part <strong>of</strong> <strong>the</strong> inven<strong>to</strong>ry<br />
covers <strong>emissions</strong> <strong>of</strong> CH4 and N2O. The internet site “Miljøportalen.dk”<br />
hosts a database including addresses, flow rates and information on <strong>the</strong><br />
content <strong>of</strong> degradable organic matter in <strong>the</strong> inlet waste water (referred <strong>to</strong><br />
as BI5). The emission calculation is carried out as national <strong>to</strong>tal in <strong>the</strong><br />
wastewater emission <strong>model</strong> in <strong>the</strong> Danish emission inven<strong>to</strong>ry system.<br />
Emissions are spatially distributed according <strong>to</strong> <strong>the</strong> BI5 value for each<br />
plant.<br />
&UHPDWLRQV<br />
Cremation covers both cremation <strong>of</strong> corpses and incineration <strong>of</strong> carcasses<br />
and includes <strong>emissions</strong> <strong>of</strong> all pollutants except CO2, which is excluded in<br />
line with <strong>the</strong> procedure for o<strong>the</strong>r biomass related CO2 <strong>emissions</strong>. The<br />
Danish Crema<strong>to</strong>rium Association registers <strong>the</strong> number <strong>of</strong> cremation <strong>of</strong><br />
corpses at <strong>the</strong> 32 Danish crema<strong>to</strong>ries on an annual basis and <strong>the</strong> estimated<br />
emission is distributed on <strong>the</strong> crema<strong>to</strong>ries weighted by <strong>the</strong> number<br />
<strong>of</strong> cremations in <strong>the</strong> current year. Incineration <strong>of</strong> carcasses takes<br />
place at three pet crema<strong>to</strong>ries and information on <strong>the</strong> weight <strong>of</strong> carcasses<br />
45
46<br />
cremated a year collected from <strong>the</strong> pet crema<strong>to</strong>ries are used for <strong>distribution</strong><br />
<strong>of</strong> <strong>the</strong> national emission.<br />
&RPSRVW SURGXFWLRQ<br />
Compost production was not implemented in <strong>the</strong> reporting for 2008, but<br />
as <strong>the</strong> data is available and will be included in future reporting this<br />
source is implemented in <strong>SPREAD</strong>. The inven<strong>to</strong>ry for composting includes<br />
<strong>emissions</strong> <strong>of</strong> CH4, CO, N2O and NH3. Compost production in<br />
Denmark is dominated by garden and park waste, which mainly occurs<br />
at a large number <strong>of</strong> recycling depots. In <strong>the</strong> present spatial <strong>distribution</strong><br />
<strong>emissions</strong> from compost production are distributed according <strong>to</strong> <strong>the</strong> areas<br />
with one-s<strong>to</strong>rey buildings as <strong>the</strong> recycling depots are not geocoded<br />
yet.<br />
$FFLGHQWDO ILUHV<br />
Accidental fires are grouped in a number <strong>of</strong> categories covering vehicles,<br />
detached houses, undetached houses, apartment buildings and industrial<br />
buildings. The inven<strong>to</strong>ry include <strong>emissions</strong> <strong>of</strong> all pollutants except<br />
N2O, NH3, Se, HCB and benzo(b)flouran<strong>the</strong>ne due <strong>to</strong> lack <strong>of</strong> emission<br />
fac<strong>to</strong>rs. Geographical location <strong>of</strong> <strong>the</strong> fires is not yet included in <strong>the</strong> inven<strong>to</strong>ry<br />
for accidental fires and <strong>the</strong> emission is distributed according <strong>to</strong><br />
<strong>the</strong> population <strong>distribution</strong>.<br />
12 IURP KXPDQ VHZDJH<br />
The source called N2O from human sewage covers direct <strong>emissions</strong> from<br />
wastewater treatment processes and indirect <strong>emissions</strong> from <strong>the</strong> outlet<br />
wastewater. The calculated <strong>emissions</strong> are distributed between <strong>the</strong><br />
wastewater treatment plants according <strong>to</strong> BI5 in <strong>the</strong> same way as <strong>emissions</strong><br />
from wastewater treatment.<br />
5HVXOWV IRU ZDVWH<br />
Figure 7.1 shows <strong>the</strong> <strong>emissions</strong> <strong>of</strong> CH4 from <strong>the</strong> waste sec<strong>to</strong>r. The grid<br />
cells with <strong>the</strong> largest <strong>emissions</strong> are enhanced with circular symbols. The<br />
largest <strong>emissions</strong> occur at <strong>the</strong> point sources covering wastewater treatment<br />
plants and solid waste disposals, <strong>the</strong> latter having <strong>the</strong> largest <strong>to</strong>tal<br />
and site-specific <strong>emissions</strong>. Accidental fires are assumed <strong>to</strong> happen<br />
where <strong>the</strong> population is located, which leads <strong>to</strong> <strong>emissions</strong> at almost <strong>the</strong><br />
entire land area.
Figure 7.1 Emission <strong>of</strong> CH4 from <strong>the</strong> waste sec<strong>to</strong>r in 2008. Green and blue areas are land and sea areas without <strong>emissions</strong>.<br />
The grid cells with largest <strong>emissions</strong> are enhanced by use <strong>of</strong> symbols.<br />
47
48<br />
6SDWLDO GLVWULEXWLRQ RI QDWLRQDO<br />
HPLVVLRQV<br />
A component in <strong>SPREAD</strong> combines all sub-<strong>model</strong>s <strong>to</strong> get a <strong>distribution</strong><br />
<strong>of</strong> <strong>the</strong> <strong>to</strong>tal Danish <strong>emissions</strong>. The pattern <strong>of</strong> <strong>the</strong> <strong>emissions</strong> depends on<br />
<strong>the</strong> pollutant, as different sources are dominant for different pollutants.<br />
In Figure 8.1, Figure 8.2 and Figure 8.3 <strong>the</strong> <strong>emissions</strong> <strong>of</strong> greenhouse gases<br />
in CO2 equivalents, <strong>of</strong> NMVOC and <strong>of</strong>PM2.5 are shown. The pattern for<br />
<strong>emissions</strong> <strong>of</strong> greenhouse gases is more homogeneous than is <strong>the</strong> case for<br />
NMVOC and PM2.5. The more even <strong>distribution</strong> owe <strong>to</strong> two facts. First,<br />
agriculture is a major source <strong>of</strong> <strong>the</strong> greenhouse gases CH4 and N2O,<br />
which both have high global warming potentials (21 and 310, respectively)<br />
and <strong>the</strong>reby are weighted higher in CO2 equivalents than CO2.<br />
Second, energy consumption for power and heat production and transport<br />
are important sources <strong>of</strong> greenhouse gases <strong>emissions</strong>. Toge<strong>the</strong>r<br />
<strong>the</strong>se circumstances contribute <strong>to</strong> allocate <strong>emissions</strong> in all parts <strong>of</strong> Denmark.<br />
Figure 8.1 National emission <strong>of</strong> greenhouse gases in 2008.<br />
Emissions <strong>of</strong> NMVOC are far more concentrated in urban and industrial<br />
areas. Emissions from solvents and o<strong>the</strong>r product use and <strong>emissions</strong> from<br />
industrial processes are also important sources. Fur<strong>the</strong>rmore a number <strong>of</strong><br />
point sources (LPS and PS) contribute with very large <strong>emissions</strong>.
Figure 8.2 National emission <strong>of</strong> NMVOC in 2008.<br />
Figure 8.3 National emission <strong>of</strong> PM2.5 in 2008.<br />
Wood combustion in residential plants is <strong>the</strong> main source <strong>of</strong> emission<br />
from particulate matter in Denmark. O<strong>the</strong>r important sources are mobile<br />
sources, especially road transport, and agriculture, especially manure<br />
management. The national <strong>distribution</strong> <strong>of</strong> PM2.5 is relatively homogeneous<br />
according <strong>to</strong> <strong>the</strong> <strong>distribution</strong> <strong>of</strong> <strong>emissions</strong> from residential plants on<br />
municipality level. PM2.5 from mobile sources enhances <strong>the</strong> major roads<br />
(highways) and <strong>the</strong> military exercise areas.<br />
49
50<br />
'LVFXVVLRQ DQG SRWHQWLDO LPSURYHPHQWV<br />
This report describes <strong>the</strong> first version <strong>of</strong> <strong>SPREAD</strong>. During <strong>the</strong> work process<br />
on setting up <strong>the</strong> <strong>model</strong> a number <strong>of</strong> potential improvements has<br />
been identified. In some cases <strong>the</strong> necessary data are available but is not<br />
yet implemented in <strong>the</strong> inven<strong>to</strong>ry calculations or in <strong>SPREAD</strong>. In o<strong>the</strong>r<br />
cases it is not known if data required for improvements exists and if it<br />
can be made available for use in <strong>the</strong> inven<strong>to</strong>ry system or in <strong>SPREAD</strong>.<br />
The potential improvements are described in <strong>the</strong> following paragraphs.<br />
In all cases it will be considered both if it is possible <strong>to</strong> include <strong>the</strong> improvement<br />
and if <strong>the</strong> benefit <strong>of</strong> <strong>the</strong> improvement is in proportion with<br />
<strong>the</strong> required workload <strong>of</strong> implementation.<br />
6WDWLRQDU\ FRPEXVWLRQ SRLQW VRXUFHV<br />
In 2010 work has been carried out <strong>to</strong> improve <strong>the</strong> correctness <strong>of</strong> <strong>the</strong> EPT<br />
(database from <strong>the</strong> DEA including fuel consumption for each district<br />
heating or power-producing plant) e.g. all SNAP codes has been checked<br />
and corrected according <strong>to</strong> <strong>the</strong> given facility type and size. The improved<br />
dataset will be included in <strong>the</strong> next version <strong>of</strong> <strong>SPREAD</strong>.<br />
6WDWLRQDU\ FRPEXVWLRQ DUHD VRXUFHV<br />
Improvements <strong>of</strong> <strong>the</strong> conversions will be incorporated if possible. The<br />
Regional Inven<strong>to</strong>ry <strong>of</strong> energy consumption for heating for oil boilers, natural<br />
gas boilers and solid fuel installations by <strong>the</strong> Danish Energy Agency<br />
used for <strong>distribution</strong> <strong>of</strong> part <strong>of</strong> <strong>the</strong> <strong>emissions</strong> from stationary combustion<br />
from area sources at SNAP 01, 02 and 03, is made for <strong>the</strong> year 2005.<br />
It would improve <strong>the</strong> <strong>distribution</strong> <strong>to</strong> use an updated data set for <strong>the</strong> latest<br />
his<strong>to</strong>rical year. The Regional Inven<strong>to</strong>ry is based on data from <strong>the</strong><br />
Building and Housing Register (BBR) by <strong>the</strong> end <strong>of</strong> 2005. In 2009 a new<br />
version <strong>of</strong> BBR was released and inclusion <strong>of</strong> this new BBR could lead <strong>to</strong><br />
a better <strong>distribution</strong>. Wood combustion in residential plants is an important<br />
source for a number <strong>of</strong> pollutants, e.g. particulate matter, PAHs and<br />
some heavy metals. In <strong>the</strong> present <strong>model</strong> <strong>emissions</strong> from residential<br />
wood combustion are distributed on municipality level according <strong>to</strong> <strong>the</strong><br />
Regional Inven<strong>to</strong>ry. To improve this part a <strong>model</strong> for <strong>distribution</strong> <strong>of</strong><br />
<strong>emissions</strong> from residential wood combustion created in <strong>the</strong> research project<br />
WOODUSE could be applied. This <strong>model</strong> is based on a bot<strong>to</strong>m-up<br />
approach where <strong>the</strong> heating requirements are estimated on address<br />
level. Data from BBR are used as input in <strong>the</strong> <strong>model</strong> and a number <strong>of</strong> criteria<br />
are set up for estimation <strong>of</strong> <strong>the</strong> heating requirements, here among a<br />
selection <strong>of</strong> which addresses should be included in <strong>the</strong> <strong>model</strong>. Before a<br />
potential implementation <strong>of</strong> this sub-<strong>model</strong>, <strong>the</strong> criteria and equations<br />
will be re-evaluated. A detailed description <strong>of</strong> <strong>the</strong> <strong>model</strong> is required if it<br />
is implemented in a later version <strong>of</strong> <strong>SPREAD</strong>.
0RELOH 6RXUFHV<br />
For <strong>the</strong> sources Aviation and Navigation it will be considered if more<br />
flight and ferry routes are <strong>to</strong> be handled separately <strong>to</strong> reduce <strong>the</strong> residual<br />
<strong>emissions</strong> that are distributed on <strong>the</strong> major flight routes and on <strong>the</strong> Danish<br />
sea terri<strong>to</strong>ry, respectively.<br />
The <strong>distribution</strong> <strong>of</strong> <strong>emissions</strong> from railways is distributed evenly on <strong>the</strong><br />
railway network in <strong>the</strong> present version <strong>of</strong> <strong>SPREAD</strong>. This part could be<br />
improved by including fur<strong>the</strong>r data on <strong>the</strong> rail activity or number <strong>of</strong> passengers<br />
on different parts <strong>of</strong> <strong>the</strong> network, e.g. data on numbers <strong>of</strong> passenger<br />
and goods trains between given stations from Statistics Denmark.<br />
This improvement is considered very time consuming and <strong>the</strong> gains are<br />
assumed <strong>to</strong> be relatively small for <strong>the</strong> <strong>model</strong> performance.<br />
It will be considered whe<strong>the</strong>r <strong>the</strong> <strong>distribution</strong> would be improved if<br />
<strong>emissions</strong> from national fishing were distributed on <strong>the</strong> major fishing<br />
banks instead <strong>of</strong> on <strong>the</strong> national sea terri<strong>to</strong>ry.<br />
)XJLWLYH HPLVVLRQV IURP IXHOV<br />
Work will continue <strong>to</strong> try <strong>to</strong> get data on <strong>the</strong> natural gas <strong>distribution</strong> network<br />
<strong>to</strong> improve <strong>the</strong> <strong>distribution</strong>. Also an updated list <strong>of</strong> service stations<br />
will be included if it becomes available as <strong>the</strong> list used in <strong>the</strong> present<br />
<strong>model</strong> is from 2001.<br />
,QGXVWULDO SURFHVVHV<br />
It will be evaluated if a better <strong>distribution</strong> key for <strong>emissions</strong> from industrial<br />
processes could be set up. For some industry categories a small<br />
number <strong>of</strong> companies account for a large part <strong>of</strong> <strong>the</strong> <strong>emissions</strong> but are<br />
not treated as LPS in <strong>the</strong> inven<strong>to</strong>ry database. If direct or estimated <strong>emissions</strong><br />
for some single companies become available this would be an improvement.<br />
Even if <strong>emissions</strong> for single companies are not available<br />
<strong>the</strong>re could still be room for improvements in splitting up <strong>the</strong> emission<br />
from a defined industry by an assumption <strong>of</strong> how much a number <strong>of</strong> major<br />
companies make up <strong>of</strong> <strong>the</strong> <strong>to</strong>tal for <strong>the</strong> industry. Ano<strong>the</strong>r approach is<br />
<strong>to</strong> include employment statistics on municipality and industry from Statistics<br />
Denmark. The employment statistics might be combined with <strong>the</strong><br />
industrial area at least for some industries.<br />
For some industries it might be an improvement <strong>to</strong> use ano<strong>the</strong>r <strong>distribution</strong><br />
key than <strong>the</strong> industrial area. This might be <strong>the</strong> case for e.g. <strong>the</strong> food<br />
and drink industries as part <strong>of</strong> <strong>the</strong> <strong>emissions</strong> come from bakeries, which<br />
are assumed <strong>to</strong> be situated more like <strong>the</strong> population than like <strong>the</strong> industrial<br />
areas.<br />
) JDVHV<br />
The <strong>distribution</strong> <strong>of</strong> F-gas <strong>emissions</strong> could be improved by splitting <strong>the</strong><br />
<strong>emissions</strong> in<strong>to</strong> categories, e.g. household and industries. It will be evaluated<br />
if <strong>the</strong> necessary data is available.<br />
51
52<br />
6ROYHQWV DQG RWKHU SURGXFW XVH<br />
As for industrial processes it will be evaluated if <strong>the</strong> <strong>emissions</strong> related <strong>to</strong><br />
industries could be distributed more appropriate than evenly on <strong>the</strong> industrial<br />
area. Again employment statistics might be a useful data source.<br />
6ROLG ZDVWH GLVSRVDO<br />
In <strong>the</strong> present version <strong>of</strong> <strong>SPREAD</strong> <strong>emissions</strong> from solid waste disposal<br />
are distributed evenly on <strong>the</strong> disposal sites. It would improve <strong>the</strong> <strong>distribution</strong><br />
if <strong>the</strong> inven<strong>to</strong>ry was made at site level and not at national level as<br />
is <strong>the</strong> case now. Data <strong>to</strong> restructure <strong>the</strong> emission inven<strong>to</strong>ry on disposal<br />
site level is available, but <strong>the</strong> restructuring would be very time consuming<br />
and would only improve <strong>the</strong> spatial <strong>distribution</strong> and not <strong>the</strong> national<br />
inven<strong>to</strong>ry. This improvement will be included if a restructuring is carried<br />
out.<br />
:DVWHZDWHU WUHDWPHQW<br />
In <strong>the</strong> present inven<strong>to</strong>ry <strong>emissions</strong> from wastewater treatment are distributed<br />
according <strong>to</strong> <strong>the</strong> degradable organic matter in <strong>the</strong> inlet wastewater.<br />
It would improve <strong>the</strong> <strong>distribution</strong> <strong>to</strong> include <strong>the</strong> fraction being treated<br />
under anaerobic conditions. Data are not available at <strong>the</strong> moment but<br />
efforts will be made <strong>to</strong> gain access <strong>to</strong> such data due <strong>to</strong> improvement <strong>of</strong><br />
<strong>the</strong> emission inven<strong>to</strong>ry for wastewater.<br />
&RPSRVW SURGXFWLRQ<br />
Geographical coordinates are not available for <strong>the</strong> Danish recycling depots<br />
for use in <strong>SPREAD</strong> and <strong>the</strong> <strong>emissions</strong> are distributed on areas with<br />
one-s<strong>to</strong>rage buildings in <strong>the</strong> present version <strong>of</strong> <strong>SPREAD</strong>. It would be an<br />
improvement <strong>to</strong> distribute part <strong>of</strong> <strong>the</strong> <strong>emissions</strong> on <strong>the</strong> recycling depots,<br />
as only a limited amount is composted in private gardens.<br />
The <strong>distribution</strong> could be improved if <strong>the</strong> plants handling garden and<br />
park waste were geo-coded and used for ei<strong>the</strong>r equal <strong>distribution</strong> or<br />
weighted due <strong>to</strong> <strong>the</strong> waste amounts.<br />
$FFLGHQWDO ILUHV<br />
It will be evaluated if it would be possible <strong>to</strong> allocate all or a part <strong>of</strong> <strong>the</strong><br />
accidental fires on a geographical level, e.g. municipality, city, fire department<br />
or fire station.
&RQFOXVLRQ<br />
The <strong>SPREAD</strong> <strong>model</strong> has been prepared as part <strong>of</strong> <strong>the</strong> emission inven<strong>to</strong>ry<br />
project at <strong>the</strong> National Environmental Research Institute, Aarhus University.<br />
<strong>SPREAD</strong> will be applied for <strong>the</strong> next manda<strong>to</strong>ry reporting <strong>of</strong><br />
gridded <strong>emissions</strong> <strong>to</strong> CLRTAP primo 2012.<br />
Former spatial <strong>distribution</strong>s have had a ra<strong>the</strong>r low resolution (50x50 km<br />
and 17x17 km) compared <strong>to</strong> <strong>the</strong> Danish area and are considered less useful<br />
for <strong>air</strong> quality <strong>model</strong>ling, health effect estimation and associated costbenefit<br />
analysis. As <strong>emissions</strong> in <strong>the</strong> national inven<strong>to</strong>ry in most cases are<br />
based on very detailed data and as <strong>the</strong> resulting <strong>emissions</strong> are considered<br />
<strong>to</strong> have small uncertainties, a high spatial resolution <strong>distribution</strong><br />
will improve <strong>the</strong> use <strong>of</strong> emission data in many contexts.<br />
To ensure that <strong>the</strong> spatial <strong>distribution</strong> reflect <strong>the</strong> degree <strong>of</strong> detail in <strong>the</strong><br />
inven<strong>to</strong>ry, <strong>the</strong> <strong>emissions</strong> are distributed on a highly disaggregated level.<br />
Therefore <strong>the</strong> <strong>SPREAD</strong> <strong>model</strong> is based on SNAP categories ra<strong>the</strong>r than<br />
<strong>the</strong> NFR and CRF categories used in <strong>the</strong> national emission reporting.<br />
This has lead <strong>to</strong> demand for setting up a larger number <strong>of</strong> <strong>distribution</strong><br />
keys.<br />
A large workload has been put in <strong>the</strong> <strong>distribution</strong> <strong>of</strong> <strong>emissions</strong> in <strong>the</strong> energy<br />
sec<strong>to</strong>r. The inven<strong>to</strong>ry system handles Large Point Sources and area<br />
sources, but as <strong>the</strong> calculations in <strong>the</strong> national inven<strong>to</strong>ry system include<br />
data from a large number <strong>of</strong> point sources, <strong>the</strong>se <strong>emissions</strong> are allocated<br />
on <strong>the</strong> site <strong>of</strong> each single plant. As this approach differ from <strong>the</strong> approach<br />
in <strong>the</strong> inven<strong>to</strong>ry system, much work has been done <strong>to</strong> re-allocate<br />
fuel consumptions on SNAP categories and <strong>to</strong> apply corrections <strong>to</strong> ensure<br />
that <strong>the</strong> <strong>emissions</strong> in <strong>the</strong> inven<strong>to</strong>ry and in <strong>the</strong> <strong>distribution</strong> are exactly<br />
<strong>the</strong> same.<br />
The <strong>distribution</strong> <strong>of</strong> <strong>emissions</strong> from agriculture is based on a complex bot<strong>to</strong>m-up<br />
approach including more very large and very detailed datasets.<br />
Emissions related <strong>to</strong> animals are based on information on all registered<br />
animals in Denmark and <strong>the</strong>reby it is possible <strong>to</strong> allocate <strong>the</strong> <strong>emissions</strong><br />
very accurately. Emissions related <strong>to</strong> soils and crops are calculated on<br />
field level in consideration <strong>of</strong> crop types and soil types, and this emission<br />
allocation is very accurate as well. As is <strong>the</strong> case for <strong>the</strong> energy sec<strong>to</strong>r,<br />
<strong>the</strong> emission calculation approach differs between <strong>the</strong> inven<strong>to</strong>ry system<br />
and <strong>the</strong> bot<strong>to</strong>m-up methodology, and <strong>the</strong> latter is corrected <strong>to</strong> make sure<br />
<strong>the</strong> <strong>emissions</strong> in <strong>the</strong> <strong>distribution</strong> and in <strong>the</strong> national emission inven<strong>to</strong>ry<br />
equal.<br />
A number <strong>of</strong> point sources have been geo-coded manually ei<strong>the</strong>r by use<br />
<strong>of</strong> <strong>the</strong> public Information Server (OIS) administrated by <strong>the</strong> Danish Enterprise<br />
and Construction Authority, where coordinates can be found via<br />
addresses, or via visual identification in Google Earth. Manual geocoding<br />
has been used for e.g. municipal solid waste disposals and waste<br />
water treatment plants.<br />
53
54<br />
The completion <strong>of</strong> <strong>the</strong> <strong>SPREAD</strong> <strong>model</strong> has enhanced national emission<br />
data with a high spatial resolution for all sources and all pollutants in <strong>the</strong><br />
national emission inven<strong>to</strong>ry system. The spatial emission dataset has<br />
contributed new knowledge on both sec<strong>to</strong>ral and national level concerning<br />
<strong>the</strong> location <strong>of</strong> <strong>emissions</strong>. The <strong>model</strong> is considered very useful and<br />
brings highly improved spatial emission data for e.g. <strong>air</strong> quality <strong>model</strong>ling<br />
and health effect calculations.<br />
This first version <strong>of</strong> <strong>the</strong> <strong>model</strong> makes use <strong>of</strong> simple <strong>distribution</strong> keys for<br />
some sources. In coming versions <strong>the</strong> applied <strong>distribution</strong> keys will be<br />
reconsidered and improvements will be applied if possible. Industrial<br />
processes and stationary combustion in area sources are considered <strong>to</strong> be<br />
<strong>the</strong> sources with <strong>the</strong> most deficient <strong>distribution</strong> and <strong>the</strong>se will be given<br />
priority in <strong>the</strong> next version, especially according <strong>to</strong> <strong>emissions</strong> from food<br />
and drink industries and from stationary combustion in residential<br />
plants.
5HIHUHQFHV<br />
ETC/AEM – CITEPA, 1996: Selected nomenclature for <strong>air</strong> pollution for<br />
CORINAIR 94 inven<strong>to</strong>ry (SNAP 94). EEA, 14/06/96. Available at:<br />
http://www.eea.europa.eu/publications/92-9167-033-2/TopRep12-96-<br />
Annex-1a.pdf (06-01-2011).<br />
European Environment Agency (EEA), 2009: EMEP/EEA <strong>air</strong> pollutant<br />
emission inven<strong>to</strong>ry guidebook 2009. Technical guidance <strong>to</strong> prepare national<br />
emission inven<strong>to</strong>ries. EEA Technical Report 9/2009. Available at:<br />
http://www.eea.europa.eu/publications/emep-eea-emissioninven<strong>to</strong>ryguidebook-<br />
2009 (2010-02-03)<br />
Danish Energy Agency, 2009: The Danish Energy Statistics. (worksheet:<br />
basic data 2008.xls). Available at:<br />
http://www.ens.dk/en-<br />
US/Info/FactsAndFigures/Energy_statistics_and_indica<strong>to</strong>rs/Annual%2<br />
0Statistics/Documents/BasicData2008.xls (19-03-2010).<br />
Fauser, P. 2010: Danish Emission Inven<strong>to</strong>ry for Solvent Use in Industries<br />
and Households. National Environmental Research Institute, Aarhus<br />
University, Denmark. 47 pp. – NERI Technical Report no. 768. Available<br />
at: http://www.dmu.dk/Pub/FR768.pdf<br />
IPCC, 1996: Revised 1996 IPCC Guidelines for National Greenhouse Gas<br />
Inven<strong>to</strong>ries: Reference Manual (Volume 3). Available at:<br />
http://www.ipcc-nggip.iges.or.jp/public/gl/invs6.html (2009-03-03).<br />
IPCC, 2000: Good Practice Guidance and Uncertainty Management in<br />
National Greenhouse Gas Inven<strong>to</strong>ries. Available at:<br />
http://www.ipccnggip.iges.or.jp/public/gp/english/ (08-02-2010).<br />
Jensen, M. T., Nielsen, O-K., Mikkelsen, M. H., Win<strong>the</strong>r, M., Gyldenkærne,<br />
S., Viuf, P. Ø. & Illerup J. B., 2008a: Rapportering af Luftemissioner<br />
på Grid – Me<strong>to</strong>der og Principper. Danmarks Miljøundersøgelser, Århus<br />
Universitet. 58 s. – Faglig rapport fra DMU nr. 654. Available at:<br />
http://www.dmu.dk/Pub/FR654.pdf (in Danish with summary in English)<br />
Jensen, S.S., Hvidberg, M., Petersen, J., S<strong>to</strong>rm, L., Stausgaard, L., Becker,<br />
T., Hertel, O., 2008b: GIS-baseret national vej- og trafikdatabase 1960-<br />
2005. Danmarks Miljøundersøgelser, Aarhus Universitet. 74s – Faglig<br />
rapport fra DMU nr. 678. Available at: http://www.dmu.dk/FR678.pdf<br />
(in Danish with summary in English).<br />
Levin, G., 2009: byzone_2007.shp (GIS <strong>the</strong>me)/Personal communication.<br />
Mikkelsen M.H., Gyldenkærne, S., Poulsen, H.D., Olesen, J.E. & Sommer,<br />
S.G., 2006: Emission <strong>of</strong> ammonia, nitrous oxide and methane from Danish<br />
Agriculture 1985 – 2002. Methodology and Estimates. National Environmental<br />
Research Institute, Denmark. 90 pp –Research Notes from<br />
NERI No. 231. Available at: http://www.dmu.dk/Pub/AR231.pdf<br />
55
56<br />
Nielsen, M., Nielsen, O.-K., Plejdrup, M. & Hjelgaard, K., 2010c: Danish<br />
Emission Inven<strong>to</strong>ries for Stationary Combustion Plants. Inven<strong>to</strong>ries until<br />
2008. National Environmental Research Institute, Aarhus University,<br />
Denmark. 236 pp. – NERI Technical Report No. 795. Available at:<br />
http://www.dmu.dk/Pub/FR795.pdf<br />
Nielsen, O.-K., Lyck, E., Mikkelsen, M.H., H<strong>of</strong>fmann, L., Gyldenkærne,<br />
S., Win<strong>the</strong>r, M., Nielsen, M., Fauser, P., Thomsen, M., Plejdrup, M.S., Albrektsen,<br />
R., Hjelgaard, K., Johannsen, V.K., Vesterdal, L., Rasmussen, E.,<br />
Arfaoui, K. & Baunbæk, L. 2010a: Denmark’s National Inven<strong>to</strong>ry Report<br />
2010. Emission Inven<strong>to</strong>ries 1990-2008 - Submitted under <strong>the</strong> United Nations<br />
Framework Convention on Climate Change and <strong>the</strong> Kyo<strong>to</strong> Pro<strong>to</strong>col.<br />
National Environmental Research Institute, Aarhus University, Denmark.<br />
1178 pp. – NERI Technical Report No 784. Available at:<br />
http://www.dmu.dk/Pub/FR784.pdf<br />
Nielsen, O-K., Win<strong>the</strong>r, M., Mikkelsen, M.H., H<strong>of</strong>fmann, L., Nielsen, M.,<br />
Gyldenkærne, S., Fauser, P., Plejdrup, M.S., Albrektsen, R. & Hjelgaard,<br />
K. 2010b. Annual Danish Informative Inven<strong>to</strong>ry Report <strong>to</strong> UNECE. Emission<br />
inven<strong>to</strong>ries from <strong>the</strong> base year <strong>of</strong> <strong>the</strong> pro<strong>to</strong>cols <strong>to</strong> year 2008. National<br />
Environmental Research Institute, Aarhus University, Denmark.<br />
565pp. – NERI Technical Report no 776. Available at:<br />
http://www.dmu.dk/Pub/FR776.pdf<br />
Plejdrup, M.S. (ed.), 2009: Drivhusgasser – kilder, opgørelsesme<strong>to</strong>der og<br />
internationale forpligtelser. Forlaget Hovedland. 112 p. Miljøbiblioteket<br />
nr 16. Available at: http://www2.dmu.dk/Pub/MB16.pdf (in Danish)<br />
Plejdrup, M.S., Nielsen, O.-K. & Nielsen, M. 2009: Emission Inven<strong>to</strong>ry for<br />
Fugitive Emissions in Denmark. National Environmental Research Institute,<br />
Aarhus University, Denmark. 47 pp. – NERI Technical Report no.<br />
739. Available at: http://www.dmu.dk/pub/FR739.pdf<br />
Thomsen, M. & Lyck, E. 2005: Emission <strong>of</strong> CH4 and N2O from Wastewater<br />
Treatment Plants (6B). National Environmental Research Institute,<br />
Denmark. 46 pp. – Research Notes from NERI no. 208. Available at:<br />
http://research-notes.dmu.dk<br />
Win<strong>the</strong>r, M. 2008: Danish emission inven<strong>to</strong>ries for road transport and<br />
o<strong>the</strong>r mobile sources. Inven<strong>to</strong>ries until year 2006. National Environmental<br />
Research Institute, University <strong>of</strong> Aarhus. 219 pp. – NERI Technical<br />
Report No. 686. Available at: http://www.dmu.dk/Pub/FR686.pdf
$SSHQGL[ $ /LVW RI IXHO FRGHV<br />
Fuel code Fuel<br />
101 COKING COAL (GHV > 23865 kJ/kg)<br />
102 STEAM COAL (GHV > 23865 kJ/kg)<br />
103 SUB-BITUMINOUS(17435 kJ/kg
58<br />
Fuel code Fuel<br />
305 BLAST FURNACE GAS<br />
306 MIXTURE OF COKE OVEN AND BLAST FURNACE GASES<br />
307 WASTE GAS (especially chemical industry)<br />
308 REFINERY AND PETROCHEM. GAS (not condensable)<br />
309 * BIOGAS<br />
310 * BIOMASS PRODUCER GAS<br />
311 GAS WORKS GAS<br />
312 STEEL PLANT FURNACE GAS<br />
313 HYDROGEN<br />
314<br />
* Bi<strong>of</strong>uel<br />
OTHER GASEOUS FUELS
$SSHQGL[ % /LVW RI 61$3 FRGHV DQG<br />
FRUUHVSRQGLQJ 1)5 FDWHJRULHV<br />
SNAP codes are set up in three levels (ETC/AEM – CITEPA, 1996):<br />
• SNAP 1 level refers <strong>to</strong> <strong>the</strong> upper level covering 11 source categories <strong>of</strong><br />
which 9 are used in <strong>the</strong> Danish inven<strong>to</strong>ry system as agriculture are<br />
treated on NFR categories and natural sources as not occurring.<br />
• SNAP 2 level refers <strong>to</strong> <strong>the</strong> intermediate level covering 77 sub-source<br />
categories. The intermediate level mainly reflects technological criteria.<br />
• SNAP 3 level refers <strong>to</strong> <strong>the</strong> lower level and covers 375 source activities.<br />
The lower level aims <strong>to</strong> structure sources and sinks <strong>to</strong> achieve homogeneous<br />
sections according <strong>to</strong> emission generation. Fur<strong>the</strong>r, <strong>the</strong> lower<br />
level aims <strong>to</strong> give an exhaustive enumeration <strong>of</strong> sources and sinks in<br />
detail.<br />
59
List <strong>of</strong> SNAP codes, SNAP names and corresponding NFR codes and names:Ã<br />
SNAP id SNAP name NFR id NFR name<br />
010100 Public power 1A1a Electricity and heat production<br />
010101 Combustion plants >= 300 MW (boilers) 1A1a Electricity and heat production<br />
010102 Combustion plants >= 50 and < 300 MW (boilers) 1A1a Electricity and heat production<br />
010103 Combustion plants < 50 MW (boilers) 1A1a Electricity and heat production<br />
010104 Gas turbines 1A1a Electricity and heat production<br />
010105 Stationary engines 1A1a Electricity and heat production<br />
010200 District heating plants 1A1a Electricity and heat production<br />
010201 Combustion plants >= 300 MW (boilers) 1A1a Electricity and heat production<br />
010202 Combustion plants >= 50 and < 300 MW (boilers) 1A1a Electricity and heat production<br />
010203 Combustion plants < 50 MW (boilers) 1A1a Electricity and heat production<br />
010204 Gas turbines 1A1a Electricity and heat production<br />
010205 Stationary engines 1A1a Electricity and heat production<br />
010300 Petroleum refining plants 1A1b Petroleum refining<br />
010301 Combustion plants >= 300 MW (boilers) 1A1b Petroleum refining<br />
010302 Combustion plants >= 50 and < 300 MW (boilers) 1A1b Petroleum refining<br />
010303 Combustion plants < 50 MW (boilers) 1A1b Petroleum refining<br />
010304 Gas turbines 1A1b Petroleum refining<br />
010305 Stationary engines 1A1b Petroleum refining<br />
010306 Process furnaces 1A1b Petroleum refining<br />
010400 Solid fuel transformation plants 1A1c Manufacture <strong>of</strong> solid fuels and o<strong>the</strong>r energy industries<br />
010401 Combustion plants >= 300 MW (boilers) 1A1c Manufacture <strong>of</strong> solid fuels and o<strong>the</strong>r energy industries<br />
010402 Combustion plants >= 50 and < 300 MW (boilers) 1A1c Manufacture <strong>of</strong> solid fuels and o<strong>the</strong>r energy industries<br />
010403 Combustion plants < 50 MW (boilers) 1A1c Manufacture <strong>of</strong> solid fuels and o<strong>the</strong>r energy industries<br />
010404 Gas turbines 1A1c Manufacture <strong>of</strong> solid fuels and o<strong>the</strong>r energy industries<br />
010405 Stationary engines 1A1c Manufacture <strong>of</strong> solid fuels and o<strong>the</strong>r energy industries<br />
010406 Coke oven furnaces 1A1c Manufacture <strong>of</strong> solid fuels and o<strong>the</strong>r energy industries<br />
010407 O<strong>the</strong>r (coal gasification, liquefaction) 1A1c Manufacture <strong>of</strong> solid fuels and o<strong>the</strong>r energy industries<br />
010500 Coal mining, oil / gas extraction, pipeline compressors<br />
1A1c Manufacture <strong>of</strong> solid fuels and o<strong>the</strong>r energy industries<br />
010501 Combustion plants >= 300 MW (boilers) 1A1c Manufacture <strong>of</strong> solid fuels and o<strong>the</strong>r energy industries<br />
010502 Combustion plants >= 50 and < 300 MW (boilers) 1A1c Manufacture <strong>of</strong> solid fuels and o<strong>the</strong>r energy industries<br />
010503 Combustion plants < 50 MW (boilers) 1A1c Manufacture <strong>of</strong> solid fuels and o<strong>the</strong>r energy industries<br />
010504 Gas turbines 1A1c Manufacture <strong>of</strong> solid fuels and o<strong>the</strong>r energy industries<br />
010505 Stationary engines 1A1c Manufacture <strong>of</strong> solid fuels and o<strong>the</strong>r energy industries<br />
010506 Pipeline compressors 1A3e i Transport-O<strong>the</strong>r transportation, Pipeline compressors<br />
020100 Commercial and institutional plants 1A4a i Commercial/Institutional plants<br />
020101 Combustion plants >= 300 MW (boilers) 1A4a i Commercial/Institutional plants<br />
020102 Combustion plants >= 50 and < 300 MW (boilers) 1A4a i Commercial/Institutional plants<br />
020103 Combustion plants < 50 MW (boilers) 1A4a i Commercial/Institutional plants<br />
020104 Stationary gas turbines 1A4a i Commercial/Institutional plants<br />
020105 Stationary engines 1A4a i Commercial/Institutional plants<br />
020106 O<strong>the</strong>r stationary equipments 1A4a i Commercial/Institutional plants<br />
020200 Residential plants 1A4b i Residential plants<br />
020201 Combustion plants >= 50 MW (boilers) 1A4b i Residential plants<br />
020202 Combustion plants < 50 MW (boilers) 1A4b i Residential plants<br />
020203 Gas turbines 1A4b i Residential plants<br />
020204 Stationary engines 1A4b i Residential plants<br />
020205 O<strong>the</strong>r equipments (s<strong>to</strong>ves, fireplaces, cooking) 1A4b i Residential plants<br />
020300 Plants in agriculture, forestry and aquaculture 1A4c i Agriculture/Forestry/Fishing, Stationary<br />
020301 Combustion plants >= 50 MW (boilers) 1A4c i Agriculture/Forestry/Fishing, Stationary<br />
020302 Combustion plants < 50 MW (boilers) 1A4c i Agriculture/Forestry/Fishing, Stationary<br />
020303 Stationary gas turbines 1A4c i Agriculture/Forestry/Fishing, Stationary<br />
020304 Stationary engines 1A4c i Agriculture/Forestry/Fishing, Stationary<br />
020305 O<strong>the</strong>r stationary equipments 1A4c i Agriculture/Forestry/Fishing, Stationary<br />
60
List <strong>of</strong> SNAP codes, SNAP names and corresponding NFR codes and names:Ã<br />
SNAP id SNAP name NFR id NFR name<br />
030100 Combustion in boilers, gas turbines and stationary<br />
engines<br />
1A2f i Industry-O<strong>the</strong>r<br />
030101 Combustion plants >= 300 MW (boilers) 1A2f i Industry-O<strong>the</strong>r<br />
030102 Combustion plants >= 50 and < 300 MW (boilers) 1A2f i Industry-O<strong>the</strong>r<br />
030103 Combustion plants < 50 MW (boilers) 1A2f i Industry-O<strong>the</strong>r<br />
030104 Gas turbines 1A2f i Industry-O<strong>the</strong>r<br />
030105 Stationary engines 1A2f i Industry-O<strong>the</strong>r<br />
030106 O<strong>the</strong>r stationary equipments 1A2f i Industry-O<strong>the</strong>r<br />
030200 Process furnaces without contact 1A2f i Industry<br />
030203 Blast furnace cowpers 1A2a Industry-Iron and steel<br />
030204 Plaster furnaces 1A2f i Industry-O<strong>the</strong>r<br />
030205 O<strong>the</strong>r furnaces 1A2f i Industry-O<strong>the</strong>r<br />
030300 Processes with contact 1A2f i Industry-Iron and steel<br />
030301 Sinter and pelletizing plants 1A2a Industry-Iron and steel<br />
030302 Reheating furnaces steel and iron 1A2a Industry-Iron and steel<br />
030303 Gray iron foundries 1A2a Industry-Iron and steel<br />
030304 Primary lead production 2C5b Industry-Non-ferrous metals<br />
030305 Primary zinc production 2C5d Industry-Non-ferrous metals<br />
030306 Primary copper production 2C5a Industry-Non-ferrous metals<br />
030307 Secondary lead production 2C5b Industry-Non-ferrous metals<br />
030308 Secondary zinc production 2C5d Industry-Non-ferrous metals<br />
030309 Secondary copper production 2C5a Industry-Non-ferrous metals<br />
030310 Secondary aluminium production 2C3 Industry-Non-ferrous metals<br />
030311 Cement 1A2f i Industry-O<strong>the</strong>r<br />
030312 Lime (incl. iron and steel and paper pulp industry) 1A2f i Industry-O<strong>the</strong>r<br />
030313 Asphalt concrete plants 1A2f i Industry-O<strong>the</strong>r<br />
030314 Flat glass 1A2f i Industry-O<strong>the</strong>r<br />
030315 Container glass 1A2f i Industry-O<strong>the</strong>r<br />
030316 Glass wool (except binding) 1A2f i Industry-O<strong>the</strong>r<br />
030317 O<strong>the</strong>r glass 1A2f i Industry-O<strong>the</strong>r<br />
030318 Mineral wool (except binding) 1A2f i Industry-O<strong>the</strong>r<br />
030319 Bricks and tiles 1A2f i Industry-O<strong>the</strong>r<br />
030320 Fine ceramic materials 1A2f i Industry-O<strong>the</strong>r<br />
030321 Paper-mill industry (drying processes) 1A2d Industry-Pulp, Paper and Print<br />
030322 Alumina production 1A2b Industry-Non-ferrous metals<br />
030323 Magnesium production (dolomite treatment) 1A2b Industry-Non-ferrous metals<br />
030324 Nickel production (<strong>the</strong>rmal process) 2C5c Industry-Nickel production<br />
030325 Enamel production 1A2f i Industry-O<strong>the</strong>r<br />
030326 O<strong>the</strong>r 1A2f i Industry-O<strong>the</strong>r<br />
040100 Processes in petroleum industries 1B2a iv Fugitive Emissions from Fuels, Refining / s<strong>to</strong>rage<br />
040101 Petroleum products processing 1B2a iv Fugitive Emissions from Fuels, Refining / s<strong>to</strong>rage<br />
040102 Fluid catalytic cracking - CO boiler 1B2a iv Fugitive Emissions from Fuels, Refining / s<strong>to</strong>rage<br />
040103 Sulphur recovery plants 1B2a iv Fugitive Emissions from Fuels, Refining / s<strong>to</strong>rage<br />
040104 S<strong>to</strong>rage and handling <strong>of</strong> petroleum produc. in refinery<br />
1B2a iv Fugitive Emissions from Fuels, Refining / s<strong>to</strong>rage<br />
040105 O<strong>the</strong>r 1B2a iv Fugitive Emissions from Fuels, Refining / s<strong>to</strong>rage<br />
040200 Processes in iron and steel industries and collieries 2C1 Industrial Processes-Metal Production-Iron and steel<br />
040201 Coke oven (door leakage and extinction) 1B1b Fugitive <strong>emissions</strong> from fuels-Solid fuels/Transformation<br />
040202 Blast furnace charging 2C1 Industrial Processes-Metal Production-Iron and steel<br />
040203 Pig iron tapping 2C1 Industrial Processes-Metal Production-Iron and steel<br />
040204 Solid smokeless fuel 1B1b Fugitive <strong>emissions</strong> from fuels-Solid fuels/Transformation<br />
040205 Open hearth furnace steel plant 2C1 Industrial Processes-Metal Production-Iron and steel<br />
61
List <strong>of</strong> SNAP codes, SNAP names and corresponding NFR codes and names:Ã<br />
SNAP id SNAP name NFR id NFR name<br />
040206 Basic oxygen furnace steel plant 2C1 Industrial Processes-Metal Production-Iron and steel<br />
040207 Electric furnace steel plant 2C1 Industrial Processes-Metal Production-Iron and steel<br />
040208 Rolling mills 2C1 Industrial Processes-Metal Production-Iron and steel<br />
040209 Sinter and pelletizing plant (except comb. 03.03.01) 2C1 Industrial Processes-Metal Production-Iron and steel<br />
040210 O<strong>the</strong>r 2C5f Industrial Processes-Metal Production-S<strong>to</strong>rage, handling<br />
and transport<br />
040300 Processes in non-ferrous metal industries 2C3<br />
040301 Aluminium production (electrolysis) 2C3 Industrial Processes-Metal Production-Aluminium<br />
040302 Ferro alloys 2C2 Industrial Processes-Metal Production-Ferroalloys<br />
040303 Silicium production 2C5e Industrial Processes-Metal Production-O<strong>the</strong>r<br />
040304 Magnesium production (except 03.03.23) 2C5e Industrial Processes-Metal Production-O<strong>the</strong>r<br />
040305 Nickel production (except 03.03.24) 2C5e Industrial Processes-Metal Production-O<strong>the</strong>r<br />
040306 Allied metal manufacturing 2C5e Industrial Processes-Metal Production-O<strong>the</strong>r<br />
040307 Galvanizing 2C5e Industrial Processes-Metal Production-O<strong>the</strong>r<br />
040308 Electroplating 2C5e Industrial Processes-Metal Production-O<strong>the</strong>r<br />
040309 O<strong>the</strong>r 2C5e Industrial Processes-Metal Production-O<strong>the</strong>r<br />
040400 Processes in inorganic chemical industries 2B5a<br />
040401 Sulfuric acid 2B5a Industrial Processes-Chemical Industry/O<strong>the</strong>r<br />
040402 Nitric acid 2B2 Industrial Processes-Chemical Industry-Nitric Acid<br />
040403 Ammonia 2B1 Industrial Processes-Chemical Industry-Ammonia<br />
040404 Ammonium sulphate 2B5a Industrial Processes-Chemical Industry/O<strong>the</strong>r<br />
040405 Ammonium nitrate 2B5a Industrial Processes-Chemical Industry/O<strong>the</strong>r<br />
040406 Ammonium phosphate 2B5a Industrial Processes-Chemical Industry/O<strong>the</strong>r<br />
040407 NPK fertilisers 2B5a Industrial Processes-Chemical Industry/O<strong>the</strong>r<br />
040408 Urea 2B5a Industrial Processes-Chemical Industry/O<strong>the</strong>r<br />
040409 Carbon black 2B5a Industrial Processes-Chemical Industry/O<strong>the</strong>r<br />
040410 Titanium dioxide 2B5a Industrial Processes-Chemical Industry/O<strong>the</strong>r<br />
040411 Graphite 2B5a Industrial Processes-Chemical Industry/O<strong>the</strong>r<br />
040412 Calcium carbide production 2B4 Industrial Processes-Chemical Industry-Carbide<br />
040413 Chlorine production 2B5a Industrial Processes-Chemical Industry/O<strong>the</strong>r<br />
040414 Phosphate fertilizers 2B5a Industrial Processes-Chemical Industry/O<strong>the</strong>r<br />
040415 S<strong>to</strong>rage and handling <strong>of</strong> inorganic chemical products 2B5b Industrial Processes-S<strong>to</strong>rage, handling and transport<br />
040416 O<strong>the</strong>r 2B5a Industrial Processes-Chemical Industry/O<strong>the</strong>r<br />
040500 Processes in organic chemical industry (bulk production)<br />
2B5a<br />
040501 Ethylene 2B5a Industrial Processes-Chemical Industry-O<strong>the</strong>r<br />
040502 Propylene 2B5a Industrial Processes-Chemical Industry/O<strong>the</strong>r<br />
040503 1,2 dichloroethane (except 04.05.05) 2B5a Industrial Processes-Chemical Industry/O<strong>the</strong>r<br />
040504 Vinylchloride (except 04.05.05) 2B5a Industrial Processes-Chemical Industry/O<strong>the</strong>r<br />
040505 1,2 dichloroethane + vinylchloride (balanced process)<br />
2B5a Industrial Processes-Chemical Industry/O<strong>the</strong>r<br />
040506 Polyethylene Low Density 2B5a Industrial Processes-Chemical Industry/O<strong>the</strong>r<br />
040507 Polyethylene High Density 2B5a Industrial Processes-Chemical Industry/O<strong>the</strong>r<br />
040508 Polyvinylchloride 2B5a Industrial Processes-Chemical Industry/O<strong>the</strong>r<br />
040509 Polypropylene 2B5a Industrial Processes-Chemical Industry/O<strong>the</strong>r<br />
040510 Styrene 2B5a Industrial Processes-Chemical Industry/O<strong>the</strong>r<br />
040511 Polystyrene 2B5a Industrial Processes-Chemical Industry/O<strong>the</strong>r<br />
040512 Styrene butadiene 2B5a Industrial Processes-Chemical Industry/O<strong>the</strong>r<br />
040513 Styrene-butadiene latex 2B5a Industrial Processes-Chemical Industry/O<strong>the</strong>r<br />
040514 Styrene-butadiene rubber (SBR) 2B5a Industrial Processes-Chemical Industry/O<strong>the</strong>r<br />
040515 Acrylonitrile Butadiene Styrene (ABS) resins 2B5a Industrial Processes-Chemical Industry/O<strong>the</strong>r<br />
040516 Ethylene oxide 2B5a Industrial Processes-Chemical Industry/O<strong>the</strong>r<br />
040517 Formaldehyde 2B5a Industrial Processes-Chemical Industry/O<strong>the</strong>r<br />
040518 Ethylbenzene 2B5a Industrial Processes-Chemical Industry/O<strong>the</strong>r<br />
62
List <strong>of</strong> SNAP codes, SNAP names and corresponding NFR codes and names:Ã<br />
SNAP id SNAP name NFR id NFR name<br />
040519 Phtalic anhydride 2B5a Industrial Processes-Chemical Industry/O<strong>the</strong>r<br />
040520 Acrylonitrile 2B5a Industrial Processes-Chemical Industry/O<strong>the</strong>r<br />
040521 Adipic acid 2B3 Industrial Processes-Chemical Industry-Adipic Acid<br />
040522 S<strong>to</strong>rage and handling <strong>of</strong> organic chemical products 2B5b Industrial Processes-Chemical Industry-O<strong>the</strong>r<br />
040523 Glyoxylic acid 2B5a Industrial Processes-Chemical Industry/O<strong>the</strong>r<br />
040525 Pesticide production 2B5a Industrial Processes-Chemical Industry/O<strong>the</strong>r<br />
040526 Production <strong>of</strong> persistent organic compounds 2E Industrial Processes-Production <strong>of</strong> POP’s<br />
040527 O<strong>the</strong>r (phy<strong>to</strong>sanitary) 2B5a Industrial Processes-Chemical Industry-O<strong>the</strong>r<br />
040600 Processes in wood, paper pulp, food, drink and o<strong>the</strong>r 2D1<br />
industries<br />
040601 Chipboard 2D1 Industrial processes-O<strong>the</strong>r Production-Pulp and Paper<br />
040602 Paper pulp (kraft process) 2D1 Industrial processes-O<strong>the</strong>r Production-Pulp and Paper<br />
040603 Paper pulp (acid sulfite process) 2D1 Industrial processes-O<strong>the</strong>r Production-Pulp and Paper<br />
040604 Paper pulp (Neutral Sulphite Semi-Chemical process)<br />
2D1 Industrial processes-O<strong>the</strong>r Production-Pulp and Paper<br />
040605 Bread 2D2 Food and Drink<br />
040606 Wine 2D2 Food and Drink<br />
040607 Beer 2D2 Food and Drink<br />
040608 Spirits 2D2 Food and Drink<br />
040610 Ro<strong>of</strong> covering with asphalt materials 2A5 Industrial processes-Mineral Products-Asphalt Ro<strong>of</strong>ing<br />
040611 Road paving with asphalt 2A6 Industrial processes-Mineral Products-Road Paving<br />
with Asphalt<br />
040612 Cement (decarbonizing) 2A1 Industrial processes-Mineral Products-Cement production<br />
040613 Glass (decarbonizing) 2A7d Industrial processes-Mineral Products-O<strong>the</strong>r<br />
040614 Lime (decarbonizing) 2A2 Industrial processes-Mineral products/Lime production<br />
040615 Batteries manufacturing 2A7d Industrial processes-Mineral Products-O<strong>the</strong>r<br />
040616 Extraction <strong>of</strong> mineral ores 2A7a Industrial processes-Mineral Products-Quarrying and<br />
mining<br />
040617 O<strong>the</strong>r (including asbes<strong>to</strong>s products manufacturing) 2G Industrial processes-O<strong>the</strong>r<br />
040618 Limes<strong>to</strong>ne and dolomite use 2A3 Industrial processes-Limes<strong>to</strong>ne and Dolomite use<br />
040619 Soda ash production and use 2A4 Industrial processes-Soda Ash production and use<br />
040620 Wood manufacturing 2D3 Wood processing<br />
040621 Cereals handling 2D2 Food and drink<br />
040622 Explosives manufacturing 2B5a O<strong>the</strong>r chemical industry<br />
040624 Public works and building sites 2A7b Construction and demolition<br />
040625 Sugar production 2D2 Food and drink<br />
040626 Flour production 2D2 Food and drink<br />
040627 Meat curing 2D2 Food and drink<br />
040628 Bricks and tiles (decarbonizing) 2A7d O<strong>the</strong>r mineral products<br />
040629 Fine ceramic materials (decarbonizing) 2A7d O<strong>the</strong>r mineral products<br />
040630 Paper mill industry (decarbonizing) 2A7d O<strong>the</strong>r mineral products<br />
040691 Production <strong>of</strong> yellow bricks 2A2 Industrial processes-Mineral products/Lime production<br />
040692 Expanded clay products 2A2 Industrial processes-Mineral products/Lime production<br />
040698 Margarine and solid cooking fats 2D2 Food and drink<br />
040699 C<strong>of</strong>fee roasting 2D2 Food and drink<br />
040800 Production <strong>of</strong> halocarbons and sulphur hexafluoride<br />
040801 Halogenated hydrocarbons production - By-products<br />
040802 Halogenated hydrocarbons production - Fugitive<br />
040803 Halogenated hydrocarbons production - O<strong>the</strong>r<br />
040804 Sulphur hexafluoride production - By-products<br />
040805 Sulphur hexafluoride production - Fugitive<br />
040806 Sulphur hexafluoride production - O<strong>the</strong>r<br />
050100 Extraction and 1st treatment <strong>of</strong> solid fossil fuels 1B1a Coal mining and handling<br />
63
List <strong>of</strong> SNAP codes, SNAP names and corresponding NFR codes and names:Ã<br />
SNAP id SNAP name NFR id NFR name<br />
050101 Open cast mining 1B1a Coal mining and handling<br />
050102 Underground mining 1B1a Coal mining and handling<br />
050103 S<strong>to</strong>rage <strong>of</strong> solid fuel 1B1a Coal mining and handling<br />
050200 Extraction, 1st treatment and loading <strong>of</strong> liquid fossil 1B2a i Fugitive Emissions from Fuels, Oil - Exploration, Pro-<br />
fuels<br />
duction, Transport<br />
050201 Land-based activities 1B2a i Fugitive Emissions from Fuels, Oil - Exploration, Production,<br />
Transport<br />
050202 Off-shore activities 1B2a i Fugitive Emissions from Fuels, Oil - Exploration, Production,<br />
Transport<br />
050300 Extraction, 1st treatment and loading <strong>of</strong> gaseous<br />
fossil fuels<br />
1B2b Fugitive Emissions from Fuels, Natural gas<br />
050301 Land-based desulfuration 1B2b Fugitive Emissions from Fuels, Natural gas<br />
050302 Land-based activities (o<strong>the</strong>r than desulfuration) 1B2b Fugitive Emissions from Fuels, Natural gas<br />
050303 Off-shore activities 1B2b Fugitive Emissions from Fuels, Natural gas<br />
050400 Liquid fuel <strong>distribution</strong> (except gasoline <strong>distribution</strong>) 1B2a i Fugitive Emissions from Fuels, Oil - Exploration, Production,<br />
Transport<br />
050401 Marine terminals (tankers, handling and s<strong>to</strong>rage) 1B2a i Fugitive Emissions from Fuels, Oil - Exploration, Production,<br />
Transport<br />
050402 O<strong>the</strong>r handling and s<strong>to</strong>rage (including pipeline) 1B2a i Fugitive Emissions from Fuels, Oil - Exploration, Production,<br />
Transport<br />
050500 Gasoline <strong>distribution</strong> 1B2a v Fugitive Emissions from Fuels, Distribution <strong>of</strong> oil products<br />
050501 Refinery dispatch station 1B2a v Fugitive Emissions from Fuels, Distribution <strong>of</strong> oil products<br />
050502 Transport and depots (except 05.05.03) 1B2a v Fugitive Emissions from Fuels, Distribution <strong>of</strong> oil products<br />
050503 Service stations (including refuelling <strong>of</strong> cars) 1B2a v Fugitive Emissions from Fuels, Distribution <strong>of</strong> oil products<br />
050600 Gas <strong>distribution</strong> networks 1B2b Fugitive Emissions from Fuels, Natural gas<br />
050601 Pipelines 1B2b Fugitive Emissions from Fuels, Natural gas<br />
050603 Distribution networks 1B2b Fugitive Emissions from Fuels, Natural gas<br />
050699 Venting in gas s<strong>to</strong>rage 1B2c Fugitive <strong>emissions</strong> from fuels-Oil and natural<br />
gas/Flaring in oil/gas extraction<br />
050700 Geo<strong>the</strong>rmal energy extraction 1B2a vi Geo<strong>the</strong>rmal energy extraction<br />
060100 Paint application 3A1 Solvent and o<strong>the</strong>r product use-Paint application<br />
060101 Paint application : manufacture <strong>of</strong> au<strong>to</strong>mobiles 3A2 Solvent and o<strong>the</strong>r product use-Paint application<br />
060102 Paint application : car rep<strong>air</strong>ing 3A2 Solvent and o<strong>the</strong>r product use-Paint application<br />
060103 Paint application : construction and buildings 3A1 Solvent and o<strong>the</strong>r product use-Paint application<br />
060104 Paint application : domestic use (except 06.01.07) 3A1 Solvent and o<strong>the</strong>r product use-Paint application<br />
060105 Paint application : coil coating 3A2 Solvent and o<strong>the</strong>r product use-Paint application<br />
060106 Paint application : boat building 3A2 Solvent and o<strong>the</strong>r product use-Paint application<br />
060107 Paint application : wood 3A2 Solvent and o<strong>the</strong>r product use-Paint application<br />
060108 O<strong>the</strong>r industrial paint application 3A2 Solvent and o<strong>the</strong>r product use-Paint application<br />
060109 O<strong>the</strong>r non industrial paint application 3A3 Solvent and o<strong>the</strong>r product use-Paint application<br />
060200 Degreasing, dry cleaning and electronics 3B1 Solvent and o<strong>the</strong>r product use-Degreasing and dry<br />
cleaning<br />
060201 Metal degreasing 3B1 Solvent and o<strong>the</strong>r product use-Degreasing and dry<br />
cleaning<br />
060202 Dry cleaning 3B2 Solvent and o<strong>the</strong>r product use-Degreasing and dry<br />
cleaning<br />
060203 Electronic components manufacturing 3B1 Solvent and o<strong>the</strong>r product use-Degreasing and dry<br />
cleaning<br />
060204 O<strong>the</strong>r industrial cleaning 3B1 Solvent and o<strong>the</strong>r product use-Degreasing and dry<br />
cleaning<br />
060300 Chemical products manufacturing or processing 3C Solvent and o<strong>the</strong>r product use-Chemical products<br />
060301 Polyester processing 3C Solvent and o<strong>the</strong>r product use-Chemical products<br />
64
List <strong>of</strong> SNAP codes, SNAP names and corresponding NFR codes and names:Ã<br />
SNAP id SNAP name NFR id NFR name<br />
060302 Polyvinylchloride processing 3C Solvent and o<strong>the</strong>r product use-Chemical products<br />
060303 Polyurethane processing 3C Solvent and o<strong>the</strong>r product use-Chemical products<br />
060304 Polystyrene foam processing 3C Solvent and o<strong>the</strong>r product use-Chemical products<br />
060305 Rubber processing 3C Solvent and o<strong>the</strong>r product use-Chemical products<br />
060306 Pharmaceutical products manufacturing 3C Solvent and o<strong>the</strong>r product use-Chemical products<br />
060307 Paints manufacturing 3C Solvent and o<strong>the</strong>r product use-Chemical products<br />
060308 Inks manufacturing 3C Solvent and o<strong>the</strong>r product use-Chemical products<br />
060309 Glues manufacturing<br />
060310 Asphalt blowing 3C Solvent and o<strong>the</strong>r product use-Chemical products<br />
060311 Adhesive, magnetic tapes, films and pho<strong>to</strong>graphs 3C Solvent and o<strong>the</strong>r product use-Chemical products<br />
060312 Textile finishing 3C Solvent and o<strong>the</strong>r product use-Chemical products<br />
060313 Lea<strong>the</strong>r tanning 3C Solvent and o<strong>the</strong>r product use-Chemical products<br />
060314 O<strong>the</strong>r 3C Solvent and o<strong>the</strong>r product use-Chemical products<br />
060400 O<strong>the</strong>r use <strong>of</strong> solvents and related activities 3D3 Solvent and o<strong>the</strong>r product use-O<strong>the</strong>r<br />
060401 Glass wool enduction 3D3 Solvent and o<strong>the</strong>r product use-O<strong>the</strong>r<br />
060402 Mineral wool enduction 3D3 Solvent and o<strong>the</strong>r product use-O<strong>the</strong>r<br />
060403 Printing industry 3D1 Solvent and o<strong>the</strong>r product use-O<strong>the</strong>r<br />
060404 Fat, edible and non edible oil extraction 3D3 Solvent and o<strong>the</strong>r product use-O<strong>the</strong>r<br />
060405 Application <strong>of</strong> glues and adhesives 3D3 Solvent and o<strong>the</strong>r product use-O<strong>the</strong>r<br />
060406 Preservation <strong>of</strong> wood 3D3 Solvent and o<strong>the</strong>r product use-O<strong>the</strong>r<br />
060407 Underseal treatment and conservation <strong>of</strong> vehicles 3D3 Solvent and o<strong>the</strong>r product use-O<strong>the</strong>r<br />
060408 Domestic solvent use (o<strong>the</strong>r than paint application) 3D2 Solvent and o<strong>the</strong>r product use-O<strong>the</strong>r<br />
060409 Vehicles dewaxing 3D3 Solvent and o<strong>the</strong>r product use-O<strong>the</strong>r<br />
060411 Domestic use <strong>of</strong> pharmaceutical products 3D3 Solvent and o<strong>the</strong>r product use-O<strong>the</strong>r<br />
060412 O<strong>the</strong>r (preservation <strong>of</strong> seeds) 3D3 Solvent and o<strong>the</strong>r product use-O<strong>the</strong>r<br />
060500 Use <strong>of</strong> HFC, N2O, NH3, PFC and SF6 3D3<br />
060501 Anaes<strong>the</strong>sia 3D3 Anaes<strong>the</strong>sia<br />
060502 Refrigeration and <strong>air</strong> conditioning equipments using<br />
halocarbons<br />
060503 Refrigeration and <strong>air</strong> conditioning equipments using<br />
o<strong>the</strong>r products than halocarbons<br />
3D3 Refrigeration and <strong>air</strong> conditioning equipment<br />
060504 Foam blowing (except 060304)<br />
060505 Fire extinguishers<br />
060506 Aerosol cans 3D3 Aerosol cans<br />
060507 Electrical equipments<br />
060508 O<strong>the</strong>r 3D3 Solvent and o<strong>the</strong>r product use-O<strong>the</strong>r (except halocarbons<br />
and sulphur hexafluoride)<br />
060601 Use <strong>of</strong> fireworks 3D3 O<strong>the</strong>r product use<br />
060602 Use <strong>of</strong> <strong>to</strong>bacco 3D3 O<strong>the</strong>r product use<br />
060603 Use <strong>of</strong> shoes 3D3 O<strong>the</strong>r product use<br />
060604 Lubricants<br />
070100 Passenger cars 1A3b i Road Transportation, Passenger Cars<br />
070101 Highway driving 1A3b i Road Transportation, Passenger Cars<br />
070102 Rural driving 1A3b i Road Transportation, Passenger Cars<br />
070103 Urban driving 1A3b i Road Transportation, Passenger Cars<br />
070200 Light duty vehicles < 3.5 t 1A3b ii Road Transportation, Light duty vehicles<br />
070201 Highway driving 1A3b ii Road Transportation, Light duty vehicles<br />
070202 Rural driving 1A3b ii Road Transportation, Light duty vehicles<br />
070203 Urban driving 1A3b ii Road Transportation, Light duty vehicles<br />
070300 Heavy duty vehicles > 3.5 t and buses 1A3b iii Road Transportation, Heavy duty vehicles<br />
070301 Highway driving 1A3b iii Road Transportation, Heavy duty vehicles<br />
070302 Rural driving 1A3b iii Road Transportation, Heavy duty vehicles<br />
070303 Urban driving 1A3b iii Road Transportation, Heavy duty vehicles<br />
070400 Mopeds and Mo<strong>to</strong>rcycles < 50 cm3 1A3b iv Road Transportation, Mopeds and mo<strong>to</strong>rcycles<br />
65
List <strong>of</strong> SNAP codes, SNAP names and corresponding NFR codes and names:Ã<br />
SNAP id SNAP name NFR id NFR name<br />
070500 Mo<strong>to</strong>rcycles > 50 cm3 1A3b iv Road Transportation, Mopeds and mo<strong>to</strong>rcycles<br />
070501 Highway driving 1A3b iv Road Transportation, Mopeds and mo<strong>to</strong>rcycles<br />
070502 Rural driving 1A3b iv Road Transportation, Mopeds and mo<strong>to</strong>rcycles<br />
070503 Urban driving 1A3b iv Road Transportation, Mopeds and mo<strong>to</strong>rcycles<br />
070600 Gasoline evaporation from vehicles 1A3b v Gasoline Evaporation from vehicles<br />
070700 Au<strong>to</strong>mobile tyre and brake wear 1A3b vi Au<strong>to</strong>mobile tyre and brake wear<br />
070800 Au<strong>to</strong>mobile road abrasion 1A3b vii Au<strong>to</strong>mobile road abraision<br />
080100 Military 1A5b O<strong>the</strong>r, Mobile (including military)<br />
080200 Railways 1A3c Transport-Railways<br />
080201 Shunting locs 1A3c Transport-Railways-Shunting logs<br />
080202 Rail-cars 1A3c Transport-Railways-Rail cars<br />
080203 Locomotives 1A3c Transport-Railways-Locomotives<br />
080300 Inland waterways 1A3d ii Transport-Navigation, National navigation<br />
080301 Sailing boats with auxilliary engines 1A3d ii Transport-Navigation, National navigation<br />
080302 Mo<strong>to</strong>rboats / workboats 1A3d ii Transport-Navigation, National navigation<br />
080303 Personal watercraft 1A3d ii Transport-Navigation, National navigation<br />
080304 Inland goods carrying vessels 1A3d ii Transport-Navigation, National navigation<br />
080400 Maritime activities 1A3d ii<br />
080402 National sea traffic within EMEP area 1A3d ii Transport-Navigation, National navigation<br />
080403 National fishing 1A4c iii Small combustion-Agriculture/Forestry/Fishing<br />
080404 International sea traffic (international bunkers) 1A3d i (i) Transport-Navigation, International marine (bunkers)<br />
080500 Air traffic 1A3a<br />
080501 Domestic <strong>air</strong>port traffic (LTO cycles - 1000 m)(i) 1A3a i (ii) Transport-Civil aviation, International, Cruise<br />
080600 Agriculture 1A4c ii Small combustion-Agriculture/Forestry/Fishing - Off<br />
road vehicles and o<strong>the</strong>r machinery<br />
080700 Forestry 1A4c ii Small combustion-Agriculture/Forestry/Fishing - Off<br />
road vehicles and o<strong>the</strong>r machinery<br />
080800 Industry 1A2f ii Industry-Mobile<br />
080900 Household and gardening 1A4b ii Small combustion-Residential, Household and gardening<br />
(mobile)<br />
081000 O<strong>the</strong>r <strong>of</strong>f-road 1A4a ii Commercial/Institutional-Mobile<br />
081100 Off-road - Commercial and institutional 1A4a ii Commercial/Institutional-Mobile<br />
081101 Exhaust engine<br />
081102 Tyre and brake wear abrasion<br />
090200 Waste incineration 6C<br />
090201 Incineration <strong>of</strong> domestic or municipal wastes 6Cc MSW-Incineration<br />
090202 Incineration <strong>of</strong> industrial wastes (except flaring) 6Cb Industrial waste-Incineration<br />
090203 Flaring in oil refinery 1B2c Fugitive <strong>emissions</strong> from fuels-Oil and natural<br />
gas/Flaring in oil refinery<br />
090204 Flaring in chemical industries 6Ca Flaring in chemical industry<br />
090205 Incineration <strong>of</strong> sludges from waste water treatment 6Cb Sludge from waste water treatment-Incineration<br />
090206 Flaring in gas and oil extraction 1B2c Fugitive <strong>emissions</strong> from fuels-Oil and natural<br />
gas/Flaring in oil/gas extraction<br />
090207 Incineration <strong>of</strong> hospital wastes 6Ca Hospital waste-Incineration<br />
090208 Incineration <strong>of</strong> waste oil 6Cb Waste oil-Incineration<br />
090400 Solid Waste Disposal on Land 6A<br />
090401 Managed Waste Disposal on Land 6A Waste-Solid waste disposal on land-Managed Disposal<br />
090402 Unmanaged Waste Disposal Sites 6A Waste-Solid waste disposal on land-Unmanaged Sites<br />
090403 O<strong>the</strong>r 6A Waste-Solid waste disposal on land-O<strong>the</strong>r<br />
090700 Open burning <strong>of</strong> agricultural wastes (except SNAP<br />
1003)<br />
6Ce Open burning <strong>of</strong> agricultural waste<br />
66
List <strong>of</strong> SNAP codes, SNAP names and corresponding NFR codes and names:Ã<br />
SNAP id SNAP name NFR id NFR name<br />
090900 Cremation 6Cd Cremation<br />
090901 Incineration <strong>of</strong> corpses 6Cd Incineration <strong>of</strong> corpses<br />
090902 Incineration <strong>of</strong> carcasses 6Cd Incineration <strong>of</strong> carcasses<br />
091000 O<strong>the</strong>r waste treatment 6B<br />
091001 Waste water treatment in industry 6B Waste-Wastewater treatment/Industrial<br />
091002 Waste water treatment in residential/commercial<br />
sec<strong>to</strong>r<br />
6B Waste-Wastewater treatment/Domestic and commercial<br />
091003 Sludge spreading 6D Sludge spreading<br />
091005 Compost production 6D Compost production<br />
091006 Biogas production 6D Biogas production<br />
091007 Latrines 6B Waste-Wastewater treatment/Latrines<br />
091008 O<strong>the</strong>r production <strong>of</strong> fuel (refuse derived fuel)<br />
091009 Accidental fires 6D Accidental fires<br />
091099 N2O from human sewage<br />
67
68<br />
$SSHQGL[ & /LVW RI *1)5 FRGHV DQG<br />
FRUUHVSRQGLQJ 1)5 FRGHV<br />
ÃÃ ÃÃ Ã<br />
A_PublicPower 1 A 1 a Public Electricity and Heat Production<br />
B_IndustrialComb 1 A 1 b Petroleum refining<br />
B_IndustrialComb 1 A 1 c Manufacture <strong>of</strong> Solid Fuels and O<strong>the</strong>r Energy Industries<br />
B_IndustrialComb 1 A 2 a Stationary Combustion in Manufacturing Industries and Construction: Iron and Steel<br />
B_IndustrialComb 1 A 2 b Stationary Combustion in Manufacturing Industries and Construction: Non-ferrous Metals<br />
B_IndustrialComb 1 A 2 c Stationary Combustion in Manufacturing Industries and Construction: Chemicals<br />
B_IndustrialComb 1 A 2 d<br />
Stationary Combustion in Manufacturing Industries and Construction: Pulp, Paper and<br />
Print<br />
B_IndustrialComb 1 A 2 e<br />
Stationary Combustion in Manufacturing Industries and Construction: Food Processing,<br />
Beverages and Tobacco<br />
B_IndustrialComb 1 A 2 f i Stationary Combustion in Manufacturing Industries and Construction: O<strong>the</strong>r<br />
B_IndustrialComb 1 A 5 a O<strong>the</strong>r, Stationary (including Military)<br />
C_SmallComb 1 A 4 a i Commercial / institutional: Stationary<br />
C_SmallComb 1 A 4 b i Residential: Stationary plants<br />
C_SmallComb 1 A 4 c i Agriculture/Forestry/Fishing: Stationary<br />
D_IndProcess 2 A 1 Cement Production<br />
D_IndProcess 2 A 2 Lime Production<br />
D_IndProcess 2 A 3 Limes<strong>to</strong>ne and Dolomite Use<br />
D_IndProcess 2 A 4 Soda Ash Production and use<br />
D_IndProcess 2 A 5 Asphalt Ro<strong>of</strong>ing<br />
D_IndProcess 2 A 6 Road Paving with Asphalt<br />
D_IndProcess 2 A 7 a Quarrying and mining <strong>of</strong> minerals o<strong>the</strong>r than coal<br />
D_IndProcess 2 A 7 b Construction and demolition<br />
D_IndProcess 2 A 7 c S<strong>to</strong>rage, handling and transport <strong>of</strong> mineral products<br />
D_IndProcess 2 A 7 d O<strong>the</strong>r Mineral products<br />
D_IndProcess 2 B 1 Ammonia Production<br />
D_IndProcess 2 B 2 Nitric Acid Production<br />
D_IndProcess 2 B 3 Adipic Acid Production<br />
D_IndProcess 2 B 4 Carbide Production<br />
D_IndProcess 2 B 5 a O<strong>the</strong>r chemical industry<br />
D_IndProcess 2 B 5 b S<strong>to</strong>rage, handling and transport <strong>of</strong> chemical products<br />
D_IndProcess 2 C 1 Iron and Steel Production<br />
D_IndProcess 2 C 2 Ferroalloys Production<br />
D_IndProcess 2 C 3 Aluminum Production<br />
D_IndProcess 2 C 5 a Copper Production<br />
D_IndProcess 2 C 5 b Lead Production<br />
D_IndProcess 2 C 5 c Nickel Production<br />
D_IndProcess 2 C 5 d Zinc Production<br />
D_IndProcess 2 C 5 e O<strong>the</strong>r metal production<br />
D_IndProcess 2 C 5 f S<strong>to</strong>rage, handling and transport <strong>of</strong> metal products<br />
D_IndProcess 2 D 1 Pulp and Paper<br />
D_IndProcess 2 D 2 Food and Drink<br />
D_IndProcess 2 D 3 Wood processing<br />
D_IndProcess 2 E Production <strong>of</strong> POPs<br />
D_IndProcess 2 F Consumption <strong>of</strong> POPs and Heavy Metals (e.g. electrical and scientific equipment)<br />
D_IndProcess 2 G O<strong>the</strong>r production, consumption, s<strong>to</strong>rage, transportation or handling <strong>of</strong> bulk products<br />
E_Fugitive 1 B 1 a Fugitive emission from Solid Fuels: Coal Mining and Handling<br />
E_Fugitive 1 B 1 b Fugitive emission from Solid Fuels:Solid fuel transformation
ÃÃ ÃÃ Ã<br />
E_Fugitive 1 B 1 c O<strong>the</strong>r fugitive <strong>emissions</strong> from solid fuels<br />
E_Fugitive 1 B 2 a i Exploration Production, Transport<br />
E_Fugitive 1 B 2 a iv Refining / S<strong>to</strong>rage<br />
E_Fugitive 1 B 2 a v Distribution <strong>of</strong> oil products<br />
E_Fugitive 1 B 3<br />
O<strong>the</strong>r fugitive <strong>emissions</strong> from geo<strong>the</strong>rmal energy production , peat and o<strong>the</strong>r energy<br />
extraction not included in 1 B 2<br />
E_Fugitive 1 B 2 b Natural gas<br />
E_Fugitive 1 B 2 c Venting and flaring<br />
F_Solvents 3 A 1 Decorative coating application<br />
F_Solvents 3 A 2 Industrial coating application<br />
F_Solvents 3 A 3 O<strong>the</strong>r coating application<br />
F_Solvents 3 B 1 Degreasing<br />
F_Solvents 3 B 2 Dry cleaning<br />
F_Solvents 3 C Chemical products<br />
F_Solvents 3 D 1 Printing<br />
F_Solvents 3 D 2 Domestic solvent use including fungicides<br />
F_Solvents 3 D 3 O<strong>the</strong>r product use<br />
G_RoadRail 1 A 3 b i Road Transport:, Passenger cars<br />
G_RoadRail 1 A 3 b ii Road Transport:, Light duty vehicles<br />
G_RoadRail 1 A 3 b iii Road transport:, Heavy duty vehicles<br />
G_RoadRail 1 A 3 b iv Road Transport:, Mopeds & Mo<strong>to</strong>rcycles<br />
G_RoadRail 1 A 3 b v Road Transport:, Gasoline evaporation<br />
G_RoadRail 1 A 3 b vi Road Transport:, Au<strong>to</strong>mobile tyre and brake wear<br />
G_RoadRail 1 A 3 b vii Road transport:, Au<strong>to</strong>mobile road abrasion<br />
G_RoadRail 1 A 3 c Railways<br />
H_Shipping 1 A 3 d i (ii) International inland waterways<br />
H_Shipping 1 A 3 d ii National navigation (Shipping)<br />
H_Shipping 1A 4 c iii Agriculture/Forestry/Fishing: National Fishing<br />
I_OffRoadMob 1 A 2 f ii Mobile Combustion in Manufacturing Industries and Construction<br />
I_OffRoadMob 1 A 3 e Pipeline compressors<br />
I_OffRoadMob 1 A 4 a ii Commercial / institutional: Mobile<br />
I_OffRoadMob 1 A 4 b ii Residential: Household and gardening (mobile)<br />
I_OffRoadMob 1 A 4 c ii Agriculture/Forestry/Fishing: Off-road Vehicles and O<strong>the</strong>r Machinery<br />
I_OffRoadMob 1 A 5 b O<strong>the</strong>r, Mobile (Including military, land based and recreational boats)<br />
J_CivilLTO 1 A 3 a ii (i) Civil Aviation (Domestic, LTO)<br />
K_InternationalLTO 1 A 3 a i (i) International aviation (LTO)<br />
L_O<strong>the</strong>rWasteDisp 6 A Solid waste disposal on land<br />
L_O<strong>the</strong>rWasteDisp 6 D O<strong>the</strong>r waste(e)<br />
M_WasteWater 6 B Waste-water handling<br />
N_WasteIncin 6 C a Clinical waste incineration (d)<br />
N_WasteIncin 6 C b Industrial waste incineration (d)<br />
N_WasteIncin 6 C c Municipal waste incineration (d)<br />
N_WasteIncin 6 C d Cremation<br />
N_WasteIncin 6 C e Small scale waste burning<br />
O_AgriLives<strong>to</strong>ck 4 B 1 a Cattle d<strong>air</strong>y<br />
O_AgriLives<strong>to</strong>ck 4 B 1 b Cattle non-d<strong>air</strong>y<br />
O_AgriLives<strong>to</strong>ck 4 B 2 Buffalo<br />
O_AgriLives<strong>to</strong>ck 4 B 3 Sheep<br />
O_AgriLives<strong>to</strong>ck 4 B 4 Goats<br />
O_AgriLives<strong>to</strong>ck 4 B 6 Horses<br />
O_AgriLives<strong>to</strong>ck 4 B 7 Mules and asses<br />
O_AgriLives<strong>to</strong>ck 4 B 8 Swine<br />
O_AgriLives<strong>to</strong>ck 4 B 9 a Laying hens<br />
O_AgriLives<strong>to</strong>ck 4 B 9 b Broilers<br />
69
ÃÃ ÃÃ Ã<br />
O_AgriLives<strong>to</strong>ck 4 B 9 c Turkeys<br />
O_AgriLives<strong>to</strong>ck 4 B 9 d O<strong>the</strong>r Poultry<br />
O_AgriLives<strong>to</strong>ck 4 B 13 O<strong>the</strong>r<br />
P_AgriO<strong>the</strong>r 4 D 1 a Syn<strong>the</strong>tic N-fertilizers<br />
P_AgriO<strong>the</strong>r 4 D 2 a<br />
Farm-level agricultural operations including s<strong>to</strong>rage, handling and transport <strong>of</strong> agricultural<br />
products<br />
P_AgriO<strong>the</strong>r 4 D 2 b Off-farm s<strong>to</strong>rage, handling and transport <strong>of</strong> bulk agricultural products<br />
P_AgriO<strong>the</strong>r 4 D 2 c N-excretion on pasture range and paddock Unspecified<br />
P_AgriO<strong>the</strong>r 4 G Agriculture o<strong>the</strong>r(c)<br />
Q_AgriWastes 4 F Field burning <strong>of</strong> agricultural wastes<br />
R_O<strong>the</strong>r 7 A O<strong>the</strong>r (included in National Total for Entire Terri<strong>to</strong>ry)<br />
S_Natural 7 B O<strong>the</strong>r not included in national <strong>to</strong>tal <strong>of</strong> <strong>the</strong> entire terri<strong>to</strong>ry<br />
S_Natural 11A X (11 08 Volcanoes)<br />
S_Natural 11 B FF Forest fires<br />
z_Memo 1 A 3 a ii (ii) Civil aviation (Domestic, Cruise)<br />
z_Memo 1 A 3 a i (ii) International aviation (Cruise)<br />
z_Memo 1 A 3 d i (i) International maritime navigation<br />
z_Memo 1 A 3 Transport (fuel used)<br />
z_Shipping 1 A 3 d i (ii) International inland waterways<br />
70
NERI<br />
DMU<br />
National Environmental Research Institute,<br />
NERI, is a part <strong>of</strong><br />
Aarhus University.<br />
NERI undertakes research,<br />
moni<strong>to</strong>ring and consultancy<br />
within environment<br />
and nature.<br />
Fur<strong>the</strong>r information: www.neri.dk<br />
National Environmental Research Institute<br />
Danmarks Miljøundersøgelser<br />
At NERI’s website www.neri.dk<br />
you’ll fi nd information regarding ongoing<br />
research and development projects.<br />
Fur<strong>the</strong>rmore <strong>the</strong> website contains a database<br />
<strong>of</strong> publications including scientifi c articles, reports,<br />
conference contributions etc. produced by<br />
NERI staff members.<br />
National Environmental Research Institute Management<br />
Frederiksborgvej 399 Department <strong>of</strong> Arctic Environment<br />
PO Box 358 Department <strong>of</strong> Atmospheric Environ ment<br />
DK-4000 Roskilde Department <strong>of</strong> Environmental Chemistry and Microbiology<br />
Denmark Department <strong>of</strong> Marine Ecology<br />
Tel: +45 4630 1200 Department <strong>of</strong> Policy Analysis<br />
Fax: +45 4630 1114<br />
National Environmental Research Institute Department <strong>of</strong> Freshwater Ecology<br />
Vejlsøvej 25 Department <strong>of</strong> Terrestrial Ecology<br />
PO Box 314<br />
DK-8600 Silkeborg<br />
Denmark<br />
Tel: +45 8920 1400<br />
Fax: +45 8920 1414<br />
National Environmental Research Institute Department <strong>of</strong> Wildlife Ecology and Biodiversity<br />
Grenåvej 14, Kalø<br />
DK-8410 Rønde<br />
Denmark<br />
Tel: +45 8920 1700<br />
Fax: +45 8920 1514
NERI Technical Reports<br />
NERI’s website www.neri.dk contains a list <strong>of</strong> all published technical reports along with o<strong>the</strong>r<br />
NERI publications. All recent reports can be downloaded in electronic format (pdf) without<br />
charge. Some <strong>of</strong> <strong>the</strong> Danish reports include an English summary.<br />
Nr./No. 2011<br />
817 Improving <strong>the</strong> Greenlandic Greenhouse Gas Inven<strong>to</strong>ry.<br />
By Nielsen, O.-K., Baunbæk, L., Gyldenkærne, S., Bruun, H.G., Lyck, E., Thomsen, M., Mikkelsen,<br />
M.H., Albrektsen, R., H<strong>of</strong>fmann, L., Fauser, P., Win<strong>the</strong>r, M., Nielsen, M., Plejdrup, M.S., Hjelgaard,<br />
K. 46 pp.<br />
815 Danmarks biodiversitet 2010 – status, udvikling og trusler.<br />
Af Ejrnæs, R., Wiberg-Larsen, P., Holm, T.E., Josefson, A., Strandberg, B., Nygaard, B., Andersen,<br />
L.W., Winding, A., Termansen, M., Hansen, M.D.D., Søndergaard, M., Hansen, A.S., Lundsteen,<br />
S., Baattrup-Pedersen, A., Kristensen, E., Krogh, P.H., Simonsen, V., Hasler, B. & Levin, G. 152 s.<br />
(også tilgængelig i trykt udgave, DKK 150)<br />
814 Bynaturen i hverdagslivet.<br />
Af Petersen, L.K. & Nielsen, S.S. 80 s.<br />
813 Environmental moni<strong>to</strong>ring at <strong>the</strong> Seqi olivine mine 2010.<br />
By Søndergaard, J. & Asmund. G. 36 pp.<br />
2010<br />
812 Environmental moni<strong>to</strong>ring at <strong>the</strong> cryolite mine in Ivittuut, South Greenland, in 2010.<br />
By Johansen, P., Asmund, G., Rigét, F. & Schledermann, H. 34 pp.<br />
811 Environmental moni<strong>to</strong>ring at <strong>the</strong> Nalunaq Gold Mine, South Greenland, 2010.<br />
By Glahder, C.M., Søndergaard, J., Asmund, G. & Rigét, F. 32 pp.<br />
810 Danish emission inven<strong>to</strong>ries for agriculture. Inven<strong>to</strong>ries 1985 - 2009.<br />
By Mikkelsen, M.H. Albrektsen, R. & Gyldenkærne, S. 136 pp.<br />
809 Review, improvement and harmonisation <strong>of</strong> <strong>the</strong> Nordic particulate matter <strong>air</strong> emission inven<strong>to</strong>ries.<br />
By Nielsen, O.-K., Illerup, J.B., Kindbom, K., Saarinen, K., Aasestad, K., Hallsdottir, B., Win<strong>the</strong>r,<br />
M., Sjodin, Å., Makela, K. & Mikkola-Pusa, J. 77 pp.<br />
808 Temporal and spatial variations in <strong>the</strong> long-term fl uctuations <strong>of</strong> wildlife populations in Greenland.<br />
By Moshøj, C.M., Forchhammer, M. & Aastrup, P. 36 pp.<br />
807 Evaluation <strong>of</strong> local contamination sources from <strong>the</strong> former mining operation in Maarmorilik.<br />
By Johansen, P., Asmund, G., Schiedek, D. & Schledermann, H. 44 pp.<br />
806 Vandmiljø og Natur 2009. NOVANA. Tilstand og udvikling – faglig sammenfatning.<br />
Af Nordemann Jensen, P., Boutrup, S., Bijl, L. van der, Svendsen, L.M., Grant, R., Wiberg-Larsen,<br />
P., Bjerring, R., Ellermann, T., Petersen, D.L.J., Hjorth, M., Søgaard, B., Thorling, L. & Dahlgren. K.<br />
108 s.<br />
805 Arter 2009. NOVANA.<br />
Af Søgaard, B., Pihl, S., Wind, P., Clausen, P., Andersen, P.N., Bregnballe, T. & Wiberg-Larsen, P.<br />
114 s.<br />
804 Vandløb 2009. NOVANA.<br />
Af Wiberg-Larsen, P., Windolf, J., Baattrup-Pedersen, A.., Bøgestrand, J., Ovesen, N.B., Larsen,<br />
S.E., Thodsen, H., Sode, A., Kristensen, E. & Kjeldgaard, A. 98 s.<br />
803 Søer 2009. NOVANA.<br />
Af Bjerring, R. Johansson, L.S., Lauridsen, T.L., Søndergaard, M., Landkildehus, F., Sortkjær, L. &<br />
Wiindolf, J. 96 s.<br />
802 Landovervågningsoplande 2009. NOVANA.<br />
Af Grant, R., Blicher-Mathiesen, G., Jensen, P.G., Hansen, B. & Thorling, L. 124 s.<br />
801 Atmosfærisk deposition 2009. NOVANA.<br />
Af Ellermann, T., Andersen, H.V., Bossi, R., Christensen, J., Løfstrøm, P., Monies, C., Grundahl, L.<br />
& Geels, C. 95 s.<br />
800 Marine områder 2009. NOVANA. Tilstand og udvikling i miljø- og naturkvaliteten.<br />
Af Petersen, D.L.J. & Hjorth, M. (red.) 127 s.<br />
799 The Danish Air Quality Moni<strong>to</strong>ring Programme. Annual Summary for 2009.<br />
By Ellermann, T., Nordstrøm, C., Brandt, J., Christensen, J., Ketzel, M. & Jensen, S.S. 61 pp.<br />
798 Økologisk risikovurdering af genmodifi cerede planter i 2009. Rapport over behandlede<br />
forsøgsudsætninger og markedsføringssager.<br />
Af Kjellsson, G., Damgaard, C., Strandberg, M., Sørensen, J.G. & Krogh, P.H. 46 s.
[Blank page]
SpatIal dIStrIButIoN <strong>of</strong> emISSIoNS<br />
<strong>to</strong> aIr – <strong>the</strong> Spread <strong>model</strong><br />
<strong>the</strong> National environmental research Institute (NerI), aarhus<br />
university, completes <strong>the</strong> annual national emission inven<strong>to</strong>ries<br />
for greenhouse gases and <strong>air</strong> pollutants according <strong>to</strong><br />
denmark’s obligations under international conventions, e.g.<br />
<strong>the</strong> climate convention, uNfCCC and <strong>the</strong> con-vention on<br />
long-range transboundary <strong>air</strong> pollution, Clrtap. NerI has<br />
developed a <strong>model</strong> <strong>to</strong> distribute <strong>emissions</strong> from <strong>the</strong> national<br />
emission inven<strong>to</strong>ries on a 1x1 km grid covering <strong>the</strong> dan-ish<br />
land and sea terri<strong>to</strong>ry. <strong>the</strong> new spatial high resolution <strong>distribution</strong><br />
<strong>model</strong> for <strong>emissions</strong> <strong>to</strong> <strong>air</strong> (Spread) has been developed<br />
according <strong>to</strong> <strong>the</strong> requirements for reporting <strong>of</strong> gridded<br />
emis-sions <strong>to</strong> Clrtap. <strong>Spatial</strong> emission data is e.g. used as<br />
input for <strong>air</strong> quality <strong>model</strong>ling, which again serves as input for<br />
assessment and evaluation <strong>of</strong> health effects. For <strong>the</strong>se purposes<br />
dis-tributions with higher spatial resolution have been<br />
requested. previously, a <strong>distribution</strong> on <strong>the</strong> 17x17 km emep grid<br />
has been set up and used in research projects combined with<br />
detailed <strong>distribution</strong>s for a few sec<strong>to</strong>rs or sub-sec<strong>to</strong>rs e.g. a <strong>distribution</strong><br />
for <strong>emissions</strong> from road traffic on 1x1 km resolution.<br />
Spread is developed <strong>to</strong> generate improved spatial emission<br />
data for e.g. <strong>air</strong> quality <strong>model</strong>ling in exposure studies. Spread<br />
includes emission <strong>distribution</strong>s for each sec-<strong>to</strong>r in <strong>the</strong> danish<br />
inven<strong>to</strong>ry system; stationary combustion, mobile sources,<br />
fugitive <strong>emissions</strong> from fuels, industrial processes, solvents<br />
and o<strong>the</strong>r product use, agriculture and waste. this <strong>model</strong><br />
enables generation <strong>of</strong> <strong>distribution</strong>s for single sec<strong>to</strong>rs and for a<br />
number <strong>of</strong> sub-sec<strong>to</strong>rs and single sources as well. this report<br />
documents <strong>the</strong> methodologies in this first version <strong>of</strong> <strong>SPREAD</strong><br />
and presents selected results. fur<strong>the</strong>r, a number <strong>of</strong> potential<br />
improvements for later versions <strong>of</strong> Spread are addressed and<br />
discussed.<br />
ISBN: 978-87-7073-221-1<br />
ISSN: 1600-0048