Spatial distribution of emissions to air - the SPREAD model
Spatial distribution of emissions to air - the SPREAD model
Spatial distribution of emissions to air - the SPREAD model

You also want an ePaper? Increase the reach of your titles
YUMPU automatically turns print PDFs into web optimized ePapers that Google loves.
24<br />
and Environmental Planning slightly modified by adding a small number<br />
<strong>of</strong> urban areas from a zone map from AIS in 1999 (Levin, 2009).<br />
ADT <strong>of</strong> roads in urban areas is determined for each grid cell based on <strong>the</strong><br />
assumption that roadwork is distributed in <strong>the</strong> same proportion as <strong>the</strong><br />
area <strong>of</strong> urban and rural areas within each grid cell. This approach is chosen<br />
over an analysis <strong>of</strong> <strong>the</strong> entire road network since it is far less labour<br />
intensive and since it is assumed that <strong>the</strong> benefit <strong>to</strong> <strong>the</strong> <strong>to</strong>tal uncertainty<br />
will be insignificant, <strong>the</strong> purpose (<strong>model</strong>ling <strong>of</strong> <strong>air</strong> quality) taken in<strong>to</strong> account.<br />
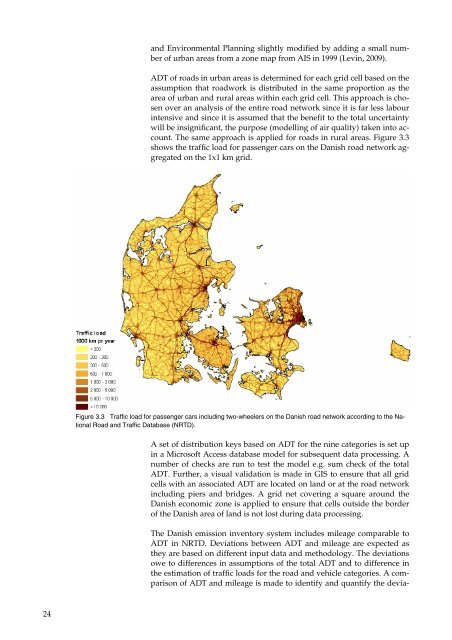
The same approach is applied for roads in rural areas. Figure 3.3<br />
shows <strong>the</strong> traffic load for passenger cars on <strong>the</strong> Danish road network aggregated<br />
on <strong>the</strong> 1x1 km grid.<br />
Figure 3.3 Traffic load for passenger cars including two-wheelers on <strong>the</strong> Danish road network according <strong>to</strong> <strong>the</strong> National<br />
Road and Traffic Database (NRTD).<br />
A set <strong>of</strong> <strong>distribution</strong> keys based on ADT for <strong>the</strong> nine categories is set up<br />
in a Micros<strong>of</strong>t Access database <strong>model</strong> for subsequent data processing. A<br />
number <strong>of</strong> checks are run <strong>to</strong> test <strong>the</strong> <strong>model</strong> e.g. sum check <strong>of</strong> <strong>the</strong> <strong>to</strong>tal<br />
ADT. Fur<strong>the</strong>r, a visual validation is made in GIS <strong>to</strong> ensure that all grid<br />
cells with an associated ADT are located on land or at <strong>the</strong> road network<br />
including piers and bridges. A grid net covering a square around <strong>the</strong><br />
Danish economic zone is applied <strong>to</strong> ensure that cells outside <strong>the</strong> border<br />
<strong>of</strong> <strong>the</strong> Danish area <strong>of</strong> land is not lost during data processing.<br />
The Danish emission inven<strong>to</strong>ry system includes mileage comparable <strong>to</strong><br />
ADT in NRTD. Deviations between ADT and mileage are expected as<br />
<strong>the</strong>y are based on different input data and methodology. The deviations<br />
owe <strong>to</strong> differences in assumptions <strong>of</strong> <strong>the</strong> <strong>to</strong>tal ADT and <strong>to</strong> difference in<br />
<strong>the</strong> estimation <strong>of</strong> traffic loads for <strong>the</strong> road and vehicle categories. A comparison<br />
<strong>of</strong> ADT and mileage is made <strong>to</strong> identify and quantify <strong>the</strong> devia-