Spatial distribution of emissions to air - the SPREAD model
Spatial distribution of emissions to air - the SPREAD model
Spatial distribution of emissions to air - the SPREAD model

You also want an ePaper? Increase the reach of your titles
YUMPU automatically turns print PDFs into web optimized ePapers that Google loves.
14<br />
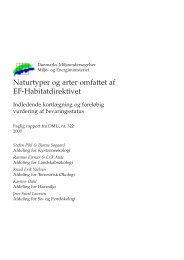
Figure 2.2 Segment around Avedøre <strong>of</strong> <strong>the</strong> map <strong>of</strong> <strong>the</strong> Danish 1x1 km grid net.<br />
To be able <strong>to</strong> distribute <strong>the</strong> <strong>emissions</strong> on 1x1 km it is necessary <strong>to</strong> split<br />
<strong>the</strong> industrial polygons between <strong>the</strong> grid cells and <strong>the</strong>reby be able <strong>to</strong> calculate<br />
<strong>the</strong> industrial area in each grid cell. These functionalities are available<br />
in a geographical information system (GIS) – in <strong>the</strong> present work<br />
ArcMap is used. The split is made using <strong>the</strong> intersect <strong>to</strong>ol and afterwards<br />
<strong>the</strong> areas are applied <strong>to</strong> each cell using <strong>the</strong> Calculate Area function.<br />
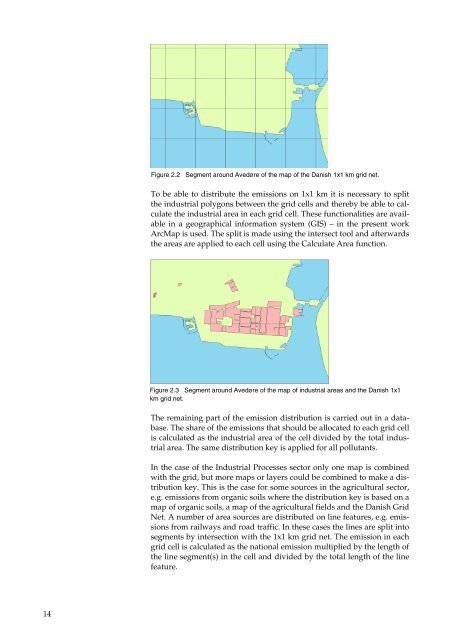
Figure 2.3 Segment around Avedøre <strong>of</strong> <strong>the</strong> map <strong>of</strong> industrial areas and <strong>the</strong> Danish 1x1<br />
km grid net.<br />
The remaining part <strong>of</strong> <strong>the</strong> emission <strong>distribution</strong> is carried out in a database.<br />
The share <strong>of</strong> <strong>the</strong> <strong>emissions</strong> that should be allocated <strong>to</strong> each grid cell<br />
is calculated as <strong>the</strong> industrial area <strong>of</strong> <strong>the</strong> cell divided by <strong>the</strong> <strong>to</strong>tal industrial<br />
area. The same <strong>distribution</strong> key is applied for all pollutants.<br />
In <strong>the</strong> case <strong>of</strong> <strong>the</strong> Industrial Processes sec<strong>to</strong>r only one map is combined<br />
with <strong>the</strong> grid, but more maps or layers could be combined <strong>to</strong> make a <strong>distribution</strong><br />
key. This is <strong>the</strong> case for some sources in <strong>the</strong> agricultural sec<strong>to</strong>r,<br />
e.g. <strong>emissions</strong> from organic soils where <strong>the</strong> <strong>distribution</strong> key is based on a<br />
map <strong>of</strong> organic soils, a map <strong>of</strong> <strong>the</strong> agricultural fields and <strong>the</strong> Danish Grid<br />
Net. A number <strong>of</strong> area sources are distributed on line features, e.g. <strong>emissions</strong><br />
from railways and road traffic. In <strong>the</strong>se cases <strong>the</strong> lines are split in<strong>to</strong><br />
segments by intersection with <strong>the</strong> 1x1 km grid net. The emission in each<br />
grid cell is calculated as <strong>the</strong> national emission multiplied by <strong>the</strong> length <strong>of</strong><br />
<strong>the</strong> line segment(s) in <strong>the</strong> cell and divided by <strong>the</strong> <strong>to</strong>tal length <strong>of</strong> <strong>the</strong> line<br />
feature.