We make our customers successful. - Oerlikon Barmag
We make our customers successful. - Oerlikon Barmag
We make our customers successful. - Oerlikon Barmag

You also want an ePaper? Increase the reach of your titles
YUMPU automatically turns print PDFs into web optimized ePapers that Google loves.
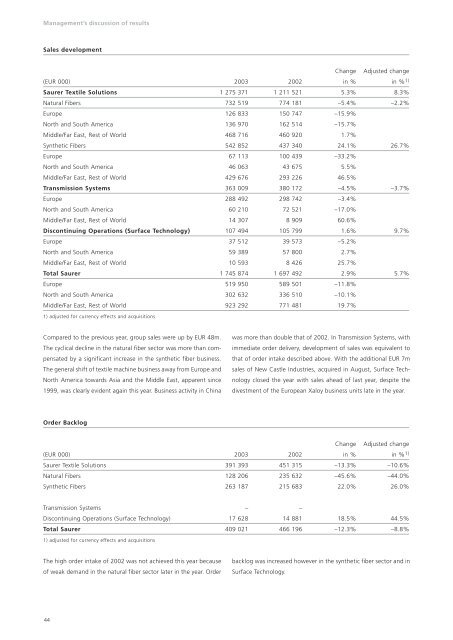
Management’s discussion of results<br />
Sales development<br />
Change Adjusted change<br />
(EUR 000) 2003 2002 in % in % 1)<br />
Saurer Textile Solutions 1 275 371 1 211 521 5.3% 8.3%<br />
Natural Fibers 732 519 774 181 –5.4% –2.2%<br />
Europe 126 833 150 747 –15.9%<br />
North and South America 136 970 162 514 –15.7%<br />
Middle/Far East, Rest of World 468 716 460 920 1.7%<br />
Synthetic Fibers 542 852 437 340 24.1% 26.7%<br />
Europe 67 113 100 439 –33.2%<br />
North and South America 46 063 43 675 5.5%<br />
Middle/Far East, Rest of World 429 676 293 226 46.5%<br />
Transmission Systems 363 009 380 172 –4.5% –3.7%<br />
Europe 288 492 298 742 –3.4%<br />
North and South America 60 210 72 521 –17.0%<br />
Middle/Far East, Rest of World 14 307 8 909 60.6%<br />
Discontinuing Operations (Surface Technology) 107 494 105 799 1.6% 9.7%<br />
Europe 37 512 39 573 –5.2%<br />
North and South America 59 389 57 800 2.7%<br />
Middle/Far East, Rest of World 10 593 8 426 25.7%<br />
Total Saurer 1 745 874 1 697 492 2.9% 5.7%<br />
Europe 519 950 589 501 –11.8%<br />
North and South America 302 632 336 510 –10.1%<br />
Middle/Far East, Rest of World 923 292 771 481 19.7%<br />
1) adjusted for currency effects and acquisitions<br />
Compared to the previous year, group sales were up by EUR 48m.<br />
The cyclical decline in the natural fiber sector was more than compensated<br />
by a significant increase in the synthetic fiber business.<br />
The general shift of textile machine business away from Europe and<br />
North America towards Asia and the Middle East, apparent since<br />
1999, was clearly evident again this year. Business activity in China<br />
Order Backlog<br />
Change Adjusted change<br />
(EUR 000) 2003 2002 in % in % 1)<br />
Saurer Textile Solutions 391 393 451 315 –13.3% –10.6%<br />
Natural Fibers 128 206 235 632 –45.6% –44.0%<br />
Synthetic Fibers 263 187 215 683 22.0% 26.0%<br />
Transmission Systems – –<br />
Discontinuing Operations (Surface Technology) 17 628 14 881 18.5% 44.5%<br />
Total Saurer 409 021 466 196 –12.3% –8.8%<br />
1) adjusted for currency effects and acquisitions<br />
The high order intake of 2002 was not achieved this year because<br />
of weak demand in the natural fiber sector later in the year. Order<br />
44<br />
was more than double that of 2002. In Transmission Systems, with<br />
immediate order delivery, development of sales was equivalent to<br />
that of order intake described above. With the additional EUR 7m<br />
sales of New Castle Industries, acquired in August, Surface Technology<br />
closed the year with sales ahead of last year, despite the<br />
divestment of the European Xaloy business units late in the year.<br />
backlog was increased however in the synthetic fiber sector and in<br />
Surface Technology.