Declaration Dr. Thomas H. Pringle - Buffalo Field Campaign
Declaration Dr. Thomas H. Pringle - Buffalo Field Campaign
Declaration Dr. Thomas H. Pringle - Buffalo Field Campaign

Create successful ePaper yourself
Turn your PDF publications into a flip-book with our unique Google optimized e-Paper software.
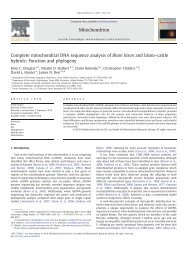
2 K.C. Douglas et al. / Mitochondrion xxx (2010) xxx–xxx<br />
1994). However, a small number of viable bison–cattle hybrids, along<br />
with a larger number of purebred bison, were used in the establishment<br />
of several bison populations following a dramatic species<br />
bottleneck in the late 19th century (Coder, 1975; Garretson, 1938).<br />
Unlike first- or second-generation backcrosses, which commonly<br />
exhibit morphological characteristics of hybridization, most advanced<br />
generation backcrosses are morphologically indistinguishable from<br />
purebred bison. As a result, cattle introgression can be found in<br />
the nuclear DNA and/or mtDNA genomes of the large majority of<br />
bison populations (Halbert and Derr, 2007; Halbert et al., 2005; Vogel<br />
et al., 2007; Ward et al., 1999) with around 3.7% of all extant bison<br />
harboring cattle mtDNA (Halbert and Derr, unpublished data from<br />
more than 10,000 bison in 150 populations).<br />
The relationship between the genera of Bos and Bison has been a<br />
source of debate for decades. In 1758, Linneaus placed bison in the<br />
genus Bos (Bos bison), but bison were subsequently moved to a<br />
sister genus (Bison) during the 19th century (Wilson and Reeder,<br />
1993). Presently, there are two extant species within the Bison<br />
genus, the European (Bison bonasus) and American bison (Bison<br />
bison) (McDonald, 1981). The generic distinction of Bison has been<br />
historically supported by analysis of anatomical distinctiveness<br />
(McDonald, 1981; Meagher, 1986; van Zyll de Jong, 1986). However,<br />
both species are capable of producing fertile offspring through<br />
hybridization with domestic cattle and other members of the genus<br />
Bos (Boyd, 1908; Goodnight, 1914; Steklenev and Yasinetskaya, 1982)<br />
strongly supporting inclusion of Bison in the Bos genus. Further<br />
support for this classification comes from morphological data (Groves,<br />
1981), blood protein analysis (Stormont et al., 1961), phylogenetic<br />
analyses of single mitochondrial regions (Burzynska et al., 1999;<br />
Janecek et al., 1996; Miyamoto et al., 1989), nuclear ribosomal DNA<br />
(Wall et al., 1992), and single nucleotide polymorphism (SNP)<br />
analysis (Decker et al., 2009).<br />
Another contentious debate involves the separation of American<br />
bison into two subspecies: B. bison bison (plains bison) and B. bison<br />
athabascae (wood bison). The histories of the two lines are similar<br />
with extreme population bottlenecks due to environmental and<br />
human factors (Isenberg, 2000). In the late 19th century, the wood<br />
bison population declined in Canada to an estimated 300 individuals<br />
in a single region (now encompassed by Wood <strong>Buffalo</strong> National<br />
Park) (Soper, 1941). Following the enactment of anti-hunting laws,<br />
the population increased to 1500–2000 bison. From 1922–1928,<br />
approximately 6600 plains bison were imported into the population,<br />
leading to a mixture of the two lines (Banfield and Novakowski, 1960;<br />
Roe, 1970). Although still somewhat phenotypically distinct, the<br />
subspecies designation has been challenged by many (Burton, 1962;<br />
Corbet, 1978; van Gelder, 1977; Wilson and Reeder, 1993) and it has<br />
been argued that the two are merely ecotypes and not subspecies<br />
(Geist, 1991). Furthermore, blood typing, RFLP, and microsatellite<br />
DNA analysis have indicated that plains and wood bison are not<br />
distinct enough to be considered subspecies (Bork et al., 1991; Peden<br />
and Kraay, 1979; Wilson and Strobeck, 1999).<br />
In this study, we sequenced the entire mtDNA genome from 43<br />
American bison and domestic cattle to examine the effects of<br />
hybridization between the two species, analyze their phylogenetic<br />
relationships, and construct the first whole mtDNA phylogenetic tree<br />
of American bison to identify population substructure and subspecific<br />
relationships. Bison with native (bison) and non-native (cattle)<br />
mtDNA were sequenced to gain insights into differences between<br />
the mitochondrial genomes which may contribute to physiological<br />
changes in hybrid (bison/cattle) individuals. Synonymous and<br />
nonsynonymous differences between bison and hybrid animals,<br />
their locations within protein-coding genes, and possible effects on<br />
tRNA secondary structure were evaluated. This study is an important<br />
step in understanding the mitochondrial sequence diversity found in<br />
bison, the role of mitochondrial function in hybridized animals, and<br />
the phylogeny of bison in relation to the Bos genus.<br />
2. Materials and methods<br />
2.1. Sampling strategy<br />
Whole blood samples were collected between 1997 and 2006.<br />
Total genomic DNA was extracted from white blood cells by<br />
proteinase K treatment followed by phenol/chloroform extraction<br />
(Sambrook et al., 1989). Sample quantity and quality was determined<br />
via spectrophotometry (ND-1000; Nano<strong>Dr</strong>op Technologies, Inc.,<br />
Wilmington, DE). Samples were stored at −80 °C prior to use.<br />
Complete mtDNA sequences were obtained from 43 bison and 3<br />
cattle (Supplemental Materials Table 1) using the following methods<br />
described. Each of the bison samples were evaluated for the presence of<br />
domestic cattle mtDNA using a PCR-based assay as previously described<br />
(Ward et al., 1999). Based on historical records and previous genetic<br />
studies, all known extant bison are derived from a handful of foundation<br />
herds established in the late 19th and 20th centuries (Coder, 1975;<br />
Garretson, 1938; Soper, 1941). To maximize haplotype diversity, efforts<br />
were made to include representative haplotypes across 5 of the<br />
foundation herds including: Yellowstone National Park (Wyoming,<br />
USA), Fort Niobrara National Wildlife Refuge (Nebraska, USA), National<br />
Bison Range (Montana, USA), Texas State Bison Herd (Texas, USA), and<br />
Elk Island National Park (Alberta, Canada). From these herds, 5 plains<br />
bison (Bison bison bison) samples and 2 wood bison samples (Bison bison<br />
athabascae) determined to contain bison mtDNA were selected for<br />
sequencing. Additionally, 36 samples from a private bison population<br />
recently created from multiple sources were evaluated, including 24<br />
with bison mtDNA and 12 with domestic cattle mtDNA (hereafter<br />
referred to as “hybrids”) (Supplemental Materials Table 1).<br />
2.2. Sequencing strategy<br />
A rapid method for sequencing both cattle and bison complete<br />
mtDNA was developed using the following strategy. Complete mtDNA<br />
sequences from human, mouse, and cattle were downloaded from<br />
publicly available databases and aligned using Clustal X (Larkin et al.,<br />
2007). Primers were designed in highly conserved regions where<br />
possible. Pairs of primers were selected across the entire bovine<br />
mtDNA genome based on the following specifications: 1) amplified<br />
fragment size of 900–1000 base pairs (bp) to allow for direct sequencing<br />
using the same (PCR) primers; 2) at least 100 bp of overlap between<br />
adjacent pairs to ensure complete sequencing coverage; 3) optimal<br />
annealing temperature of 54 °C. These criteria were necessarily adjusted<br />
in regions of low conservation. A total of 24 primer pairs were selected<br />
(Supplemental Materials Table 2) with an average estimated fragment<br />
size of 905 bp (±125.5 bp) and an average overlap of 202 bp (±99.4 bp).<br />
A standard 25 μL PCR mixture was utilized for all primer pairs,<br />
including 100 ng template DNA, 1.5 mM MgCl2, 0.025 mM each dNTP,<br />
1× MasterAmp PCR Enhancer with betaine (Epicentre), 0.048 μM each<br />
primer, 1× GeneAmp PCR Buffer II and 0.2 μL AmpliTaq ® Gold DNA<br />
polymerase (Applied Biosystems). Touch-down PCR amplification was<br />
performed on a GeneAmp PCR System 9700 (Applied Biosystems) under<br />
the following conditions: initial denaturation for 3 min at 96 °C; 3 cycles<br />
of 96 °C for 20 s, 57 °C for 30 s, and 72 °C for 1 min with a decrease in<br />
annealing temperature of 1 °C during each cycle; 37 cycles of 96 °C for<br />
20 s, 54 °C for 30 s, and 72 °C for 1 min; final extension of 72 °C for<br />
10 min. Resultant amplicons were visualized on 1% agarose gels stained<br />
with ethidium bromide and purified with a QIAquick ® PCR purification<br />
kit following the manufacturer's recommendations (Qiagen).<br />
Bi-directional dye terminator (BigDye ® v1.1, Applied Biosystems)<br />
sequencing was performed in 10 μL reactions including 90 ng<br />
template and 10 pmol primer following the manufacturer's recommendations.<br />
Sequence products were purified using sephadex G-50<br />
columns (BioMax) and visualized on a 3130xl Genetic Analyzer<br />
(Applied Biosystems). Analyzed data was evaluated and assembled<br />
into contigs using Sequencher TM 4.9 (Gene Codes Corporation).<br />
Please cite this article as: Douglas, K.C., et al., Complete mitochondrial DNA sequence analysis of Bison bison and bison–cattle hybrids:<br />
Function and phylogeny, Mitochondrion (2010), doi:10.1016/j.mito.2010.09.005