Declaration Dr. Thomas H. Pringle - Buffalo Field Campaign
Declaration Dr. Thomas H. Pringle - Buffalo Field Campaign
Declaration Dr. Thomas H. Pringle - Buffalo Field Campaign

Create successful ePaper yourself
Turn your PDF publications into a flip-book with our unique Google optimized e-Paper software.
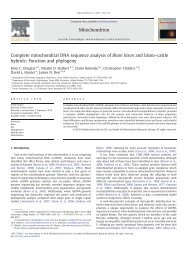
2.3. mtDNA genome analysis<br />
The complete mitochondrial sequences of 30 Bos taurus (domestic<br />
cattle, hereafter “cattle”), 2 Bos indicus (zebu), 3 Bos grunniens (yak), 1<br />
Bison bison (American bison), and 1 Bubalus bubalis (water buffalo)<br />
were obtained from GenBank (Benson et al., 2005) (Supplemental<br />
Materials Table 1). The complete mitochondrial genome sequences<br />
were aligned using Clustal X (Larkin et al., 2007) in the MEGA 4.0<br />
phylogenetic package and corrected by hand when necessary. The<br />
genomes were parsed into the following data sets for functional and<br />
phylogenetic analyses: 1) bison only; 2) bison and hybrids and 3) Bos,<br />
bison, and hybrids. To investigate the variation among bison mtDNA<br />
genomes, an unrooted haplotype network (spring tree) was created<br />
using TCS v1.21 (Clement et al., 2000).<br />
2.4. Bison–cattle hybridization analysis parameters<br />
An alignment of bison and hybrid haplotypes was created to assess<br />
differences in the two genomes. A previously published cattle mtDNA<br />
sequence (AB074966.1) was used to identify putative gene boundaries<br />
and overlapping regions. Aligned files were analyzed gene-bygene<br />
in DnaSP v5 (Librado and Rozas, 2009) using the genetic code<br />
for mammalian mtDNA to assess the total numbers of polymorphic<br />
sites, synonymous changes, and non-synonymous changes. Nonsynonymous<br />
changes were then coded by amino acid class (nonpolar,<br />
uncharged polar, positive, negative) to evaluate the number<br />
of class-changing mutations between the bison and hybrid groups.<br />
Changes in tRNA structure due to sequence differences between<br />
the bison and hybrid groups were evaluated using the online<br />
program tRNAscan-SE (Lowe and Eddy, 1997; http://lowelab.ucsc.<br />
edu/tRNAscan-SE/). The cove only method (cut-off score=20 bits)<br />
and the mito/chloroplast source definition were used. Locations of<br />
changes were recorded in the following categories: D loop/stem, T C<br />
loop/stem, central loop, anticodon loop/stem, or acceptor arm stem.<br />
2.5. Phylogenetic analysis<br />
RAxML version 7.0.3 was used to generate unweighted maximum<br />
likelihood phylogenetic trees (Stamatakis, 2006). The GTRGAMMA<br />
model was utilized, and 1000 replicates were used to generate<br />
bootstrap values. To account for different nucleotide substitution<br />
rates across the mitochondrial genome, we partitioned the sequence<br />
as follows: each of the 13 protein-coding genes and the 2 rDNA genes<br />
were treated as independent regions (15 total); the 22 tDNA genes<br />
were grouped into one large region; and the D loop was defined as<br />
an independent region. For each partition, individual alpha-shape<br />
Table 1<br />
Annotation and gene organization of the Bison bison mitochondrial genome. Order, gene, strand (heavy or light), starting and ending nucleotide position, first and last ten bases, and<br />
intergenic/overlapping nucleotides (“–” indicates overlapping regions) are based on whole mtDNA genome alignment of all bison haplotypes and comparison with published cattle<br />
sequences.<br />
Order Gene Strand Start End Length (bp) First ten bases Last ten bases Intergenic nucleotides<br />
D loop 1 364 362–364 ACTAATGGCT CCCCCCCCCC 0<br />
1 tRNA-Phe Heavy 365 431 67 GTTGATGTAG TCCATAAACA 0<br />
2 12s-rRNA Heavy 432 1387 956 CATAGGTTTG TTGGATAAAT 0<br />
3 tRNA-Val Heavy 1388 1454 67 CAAGATATAG AATATCTTGA 0<br />
4 16S rRNA Heavy 1455 3025 1570–1571 d<br />
ACTAAATCTA ACAGGGCTTA 0<br />
5 tRNA-Leu Heavy 3026 3100 75 GTTAAGGTGG CTCCTTAACA 2 (AA)<br />
6 ND1 Heavy 3103 4058 956 ATGTTCATAA CGCAAACATA a<br />
0<br />
7 tRNA-Ile Heavy 4059 4127 69 AGAAATATGT CTTATTTCTA −3 (CTA)<br />
8 tRNA-Gln Light 4125 4196 72 CTAGAACTAT CCAAATTCTA 2 (TT)<br />
9 tRNA-Met Heavy 4199 4267 69 AGTAAGGTCA TCCCGTACTA 0<br />
10 ND2 Heavy 4268 5309 1042 ATAAATCCAA GTATTAGAAT a<br />
0<br />
11 tRNA-Trp Heavy 5310 5376 67 AGGAATTTAG TTAATTCCTG 1 (C)<br />
12 tRNA-Ala Light 5378 5446 69 TAAGGATTGC CTAAATCCTC 1 (A)<br />
13 tRNA-Asn Light 5448 5521 74 b<br />
CTAGACTGGT CTTCAATCTA 0<br />
L-strand ori. of rep. Light 5522 5553 32 CTTCTCCCGC AAGGCGGGAG 0<br />
14 tRNA-Cys Light 5554 5620 67 AAGCCCCGGC CCACAGGGCT 0<br />
15 tRNA-Tyr Light 5621 5688 68 TGGTAAAAAG CCATTTTACC 1 (C)<br />
16 COI Heavy 5690 7234 1545 ATGTTCATTA CCTAAAATAA −3 (TAA)<br />
17 tRNA-Ser Light 7232 7304 71–73 d<br />
TAAGAAAGGA TCTCTCTCAA 4 (TAAA)<br />
18 tRNA-Asp Heavy 7309 7377 69 CGAAGTGTTA GTACACCTCA 1 (T)<br />
19 COII Heavy 7379 8062 684 ATGGCATACC AATATTATAA 3 (AAT)<br />
20 tRNA-Lys Heavy 8066 8132 67 CACCAAGAAG TCCTTGGTGA 1 (C)<br />
21 ATP8 Heavy 8134 8334 201 ATGCCACAAC ACCCCTATAA −40<br />
22 ATP6 Heavy 8295 8975 681 ATGAACGAAA CAACACATAA −1 (A)<br />
23 COIII Heavy 8975 9755 781 ATGACACACC TGATGAGGCT a<br />
3 (CCT)<br />
24 tRNA-Gly Heavy 9759 9827 69 ATTCTTTTAG AAAAAGAATA 0<br />
25 ND3 Heavy 9828 10,174 346 ATAAATCTAA GAACCGAATA a<br />
0<br />
26 tRNA-Arg Heavy 10,175 10,243 69 TGGTACTTAG TAATTACCAA 0<br />
27 ND4 (L) Light 10,244 10,540 297 ATGTCTATAG CCAATGCTAA −7<br />
28 ND4 Heavy 10,534 11,911 1378 ATGCTAAAAT CCTCTATACT a<br />
0<br />
29 tRNA-His Heavy 11,912 11,981 70 GTAAATATAG CTTATTTACC 0<br />
30 tRNA-Ser2 Heavy 11,982 12,041 60 GAAAAAGTAT GGCTTTTTCG 1 (A)<br />
31 tRNA-Leu2 Heavy 12,043 12,112 70 c<br />
ACTTTTAAAG AATAAAAGTA 0<br />
32 ND5 Heavy 12,113 13,933 1821 ATAAACATAT CCACGAGTAA −17<br />
33 ND6 Light 13,917 14,444 528 TTAATTTCCA ATAGTATCAT 0<br />
34 tRNA-Glu Light 14,445 14,513 69 TATTCTTACA CTACAAGAAC 4 (ACTA)<br />
35 CYTB Heavy 14,518 15,657 1140 ATGACTARCC AAAATGAAGA 4 (CAGG)<br />
36 tRNA-Thr Heavy 15,662 15,730 69 TCTTTGTAGT CCCTAAGACT −1 (T)<br />
37 tRNA-Pro Light 15,730 15,795 66 TCAAGGAAGA CTATTCCCTG 0<br />
D loop 15,796 16,325 528–530 AACGCTATTA ATCTCGATGG 0<br />
a<br />
TAA stop codon completed by addition of 3' adenine residues to mRNA.<br />
b<br />
Region has a fixed insertion in bison as compared to cattle.<br />
c<br />
Region has a fixed deletion in bison as compared to cattle.<br />
d<br />
Indel present within gene.<br />
K.C. Douglas et al. / Mitochondrion xxx (2010) xxx–xxx<br />
Please cite this article as: Douglas, K.C., et al., Complete mitochondrial DNA sequence analysis of Bison bison and bison–cattle hybrids:<br />
Function and phylogeny, Mitochondrion (2010), doi:10.1016/j.mito.2010.09.005<br />
3