Declaration Dr. Thomas H. Pringle - Buffalo Field Campaign
Declaration Dr. Thomas H. Pringle - Buffalo Field Campaign
Declaration Dr. Thomas H. Pringle - Buffalo Field Campaign

Create successful ePaper yourself
Turn your PDF publications into a flip-book with our unique Google optimized e-Paper software.
mitochondrial genome is 16318–16323 bp long (Supplemental<br />
Materials Table 1) consisting of 13 protein-coding genes, 22 tDNA<br />
genes, 2 rDNA genes, and the D-Loop region. The gene order, length,<br />
and gene coordinates for the mtDNA genome are presented in Table 1.<br />
The gene order is conserved between bison and cattle. Including both<br />
SNPs and insertion–deletion events (indels), there are 989–995<br />
differences between the bison haplotypes and the cattle genomic<br />
reference sequence. The length of the D-loop region varies by 4 bp<br />
across bison due to indels. Indels are also present in two genes within<br />
bison: 16s rRNA has a 1 bp indel at position 1880 and tRNA serine has<br />
a 2-bp variable indel at position 7301–7302. Furthermore, the stop<br />
codon for five protein-coding genes is completed by the addition of<br />
3′ adenine residues to the mRNA (Table 1) as previously reported in<br />
cattle and other species (Achilli et al., 2008; Boore et al., 2005). There<br />
are also several regions in the bison genome where intergenic<br />
nucleotides exist or where two genes overlap (Table 1). Whether<br />
these regions represent a biological phenomenon or annotation errors<br />
is unknown; however, intergenic nucleotides have been reported in<br />
other species (Achilli et al., 2008; Boore et al., 2005).<br />
In total, the 17 bison haplotypes included 66 polymorphic sites, 34<br />
singleton variable sites (SNP found in only one animal), and a pairwise<br />
average of 15.3 differences between any two sequences. For<br />
comparison, the 39 cattle haplotypes included 426 polymorphic sites,<br />
261 singleton sites, and a pair-wise average of 46.2 differences. These<br />
results lead to a 3-fold lower nucleotide diversity (π) value for the<br />
analyzed bison haplotypes (π=0.00094) than the cattle haplotypes<br />
(π=0.00283). To illustrate the total number of differences among<br />
bison haplotypes, an unrooted haplotype network was created to map<br />
the number and position of polymorphisms (Fig. 1).<br />
3.2. Bison–cattle hybridization analysis<br />
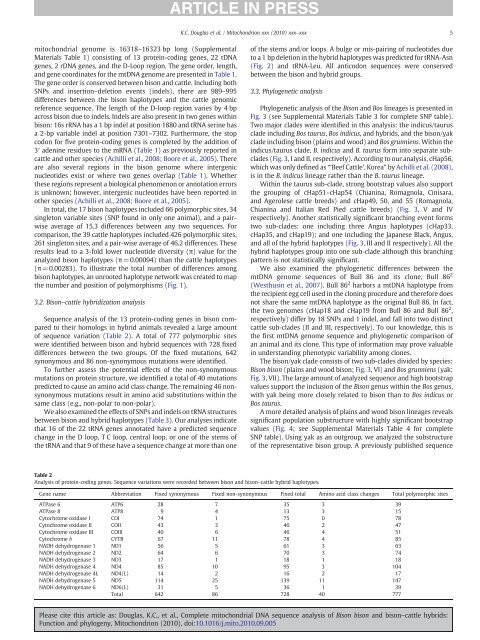
Sequence analysis of the 13 protein-coding genes in bison compared<br />
to their homologs in hybrid animals revealed a large amount<br />
of sequence variation (Table 2). A total of 777 polymorphic sites<br />
were identified between bison and hybrid sequences with 728 fixed<br />
differences between the two groups. Of the fixed mutations, 642<br />
synonymous and 86 non-synonymous mutations were identified.<br />
To further assess the potential effects of the non-synonymous<br />
mutations on protein structure, we identified a total of 40 mutations<br />
predicted to cause an amino acid class change. The remaining 46 nonsynonymous<br />
mutations result in amino acid substitutions within the<br />
same class (e.g., non-polar to non-polar).<br />
We also examined the effects of SNPs and indels on tRNA structures<br />
between bison and hybrid haplotypes (Table 3). Our analyses indicate<br />
that 16 of the 22 tRNA genes annotated have a predicted sequence<br />
change in the D loop, T C loop, central loop, or one of the stems of<br />
the tRNA and that 9 of these have a sequence change at more than one<br />
K.C. Douglas et al. / Mitochondrion xxx (2010) xxx–xxx<br />
of the stems and/or loops. A bulge or mis-pairing of nucleotides due<br />
to a 1 bp deletion in the hybrid haplotypes was predicted for tRNA-Asn<br />
(Fig. 2) and tRNA-Leu. All anticodon sequences were conserved<br />
between the bison and hybrid groups.<br />
3.3. Phylogenetic analysis<br />
Table 2<br />
Analysis of protein-coding genes. Sequence variations were recorded between bison and bison–cattle hybrid haplotypes.<br />
Phylogenetic analysis of the Bison and Bos lineages is presented in<br />
Fig. 3 (see Supplemental Materials Table 3 for complete SNP table).<br />
Two major clades were identified in this analysis: the indicus/taurus<br />
clade including Bos taurus, Bos indicus, and hybrids, and the bison/yak<br />
clade including bison (plains and wood) and Bos grunniens. Within the<br />
indicus/taurus clade, B. indicus and B. taurus form into separate subclades<br />
(Fig. 3, I and II, respectively). According to our analysis, cHap56,<br />
which was only defined as “‘Beef Cattle’, Korea” by Achilli et al. (2008),<br />
is in the B. indicus lineage rather than the B. taurus lineage.<br />
Within the taurus sub-clade, strong bootstrap values also support<br />
the grouping of cHap51–cHap54 (Chianina, Romagnola, Cinisara,<br />
and Agerolese cattle breeds) and cHap49, 50, and 55 (Romagnola,<br />
Chianina and Italian Red Pied cattle breeds) (Fig. 3, V and IV<br />
respectively). Another statistically significant branching event forms<br />
two sub-clades: one including three Angus haplotypes (cHap33,<br />
cHap35, and cHap19); and one including the Japanese Black, Angus,<br />
and all of the hybrid haplotypes (Fig. 3, III and II respectively). All the<br />
hybrid haplotypes group into one sub-clade although this branching<br />
pattern is not statistically significant.<br />
We also examined the phylogenetic differences between the<br />
mtDNA genome sequences of Bull 86 and its clone, Bull 86 2<br />
(Westhusin et al., 2007). Bull 86 2 harbors a mtDNA haplotype from<br />
the recipient egg cell used in the cloning procedure and therefore does<br />
not share the same mtDNA haplotype as the original Bull 86. In fact,<br />
the two genomes (cHap18 and cHap19 from Bull 86 and Bull 86 2 ,<br />
respectively) differ by 18 SNPs and 1 indel, and fall into two distinct<br />
cattle sub-clades (II and III, respectively). To our knowledge, this is<br />
the first mtDNA genome sequence and phylogenetic comparison of<br />
an animal and its clone. This type of information may prove valuable<br />
in understanding phenotypic variability among clones.<br />
The bison/yak clade consists of two sub-clades divided by species:<br />
Bison bison (plains and wood bison; Fig. 3, VI) and Bos grunniens (yak;<br />
Fig. 3, VII). The large amount of analyzed sequence and high bootstrap<br />
values support the inclusion of the Bison genus within the Bos genus,<br />
with yak being more closely related to bison than to Bos indicus or<br />
Bos taurus.<br />
A more detailed analysis of plains and wood bison lineages reveals<br />
significant population substructure with highly significant bootstrap<br />
values (Fig. 4; see Supplemental Materials Table 4 for complete<br />
SNP table). Using yak as an outgroup, we analyzed the substructure<br />
of the representative bison group. A previously published sequence<br />
Gene name Abbreviation Fixed synonymous Fixed non-synonymous Fixed total Amino acid class changes Total polymorphic sites<br />
ATPase 6 ATP6 28 7 35 3 39<br />
ATPase 8 ATP8 9 4 13 3 15<br />
Cytochrome oxidase I COI 74 1 75 0 78<br />
Cytochrome oxidase II COII 43 3 46 2 47<br />
Cytochrome oxidase III COIII 40 6 46 4 51<br />
Cytochrome b CYTB 67 11 78 4 85<br />
NADH dehydrogenase 1 ND1 56 5 61 3 63<br />
NADH dehydrogenase 2 ND2 64 6 70 3 74<br />
NADH dehydrogenase 3 ND3 17 1 18 1 18<br />
NADH dehydrogenase 4 ND4 85 10 95 3 104<br />
NADH dehydrogenase 4L ND4(L) 14 2 16 2 17<br />
NADH dehydrogenase 5 ND5 114 25 139 11 147<br />
NADH dehydrogenase 6 ND6(L) 31 5 36 1 39<br />
Total 642 86 728 40 777<br />
Please cite this article as: Douglas, K.C., et al., Complete mitochondrial DNA sequence analysis of Bison bison and bison–cattle hybrids:<br />
Function and phylogeny, Mitochondrion (2010), doi:10.1016/j.mito.2010.09.005<br />
5