LASS user manual - audio concepts
LASS user manual - audio concepts
LASS user manual - audio concepts

Create successful ePaper yourself
Turn your PDF publications into a flip-book with our unique Google optimized e-Paper software.
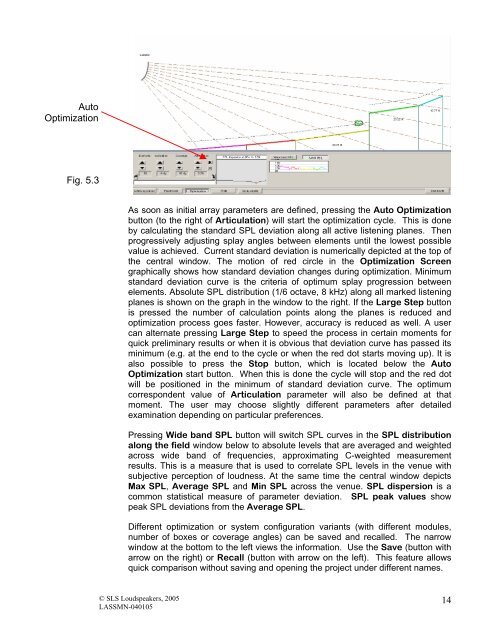
Auto<br />
Optimization<br />
Fig. 5.3<br />
As soon as initial array parameters are defined, pressing the Auto Optimization<br />
button (to the right of Articulation) will start the optimization cycle. This is done<br />
by calculating the standard SPL deviation along all active listening planes. Then<br />
progressively adjusting splay angles between elements until the lowest possible<br />
value is achieved. Current standard deviation is numerically depicted at the top of<br />
the central window. The motion of red circle in the Optimization Screen<br />
graphically shows how standard deviation changes during optimization. Minimum<br />
standard deviation curve is the criteria of optimum splay progression between<br />
elements. Absolute SPL distribution (1/6 octave, 8 kHz) along all marked listening<br />
planes is shown on the graph in the window to the right. If the Large Step button<br />
is pressed the number of calculation points along the planes is reduced and<br />
optimization process goes faster. However, accuracy is reduced as well. A <strong>user</strong><br />
can alternate pressing Large Step to speed the process in certain moments for<br />
quick preliminary results or when it is obvious that deviation curve has passed its<br />
minimum (e.g. at the end to the cycle or when the red dot starts moving up). It is<br />
also possible to press the Stop button, which is located below the Auto<br />
Optimization start button. When this is done the cycle will stop and the red dot<br />
will be positioned in the minimum of standard deviation curve. The optimum<br />
correspondent value of Articulation parameter will also be defined at that<br />
moment. The <strong>user</strong> may choose slightly different parameters after detailed<br />
examination depending on particular preferences.<br />
Pressing Wide band SPL button will switch SPL curves in the SPL distribution<br />
along the field window below to absolute levels that are averaged and weighted<br />
across wide band of frequencies, approximating C-weighted measurement<br />
results. This is a measure that is used to correlate SPL levels in the venue with<br />
subjective perception of loudness. At the same time the central window depicts<br />
Max SPL, Average SPL and Min SPL across the venue. SPL dispersion is a<br />
common statistical measure of parameter deviation. SPL peak values show<br />
peak SPL deviations from the Average SPL.<br />
Different optimization or system configuration variants (with different modules,<br />
number of boxes or coverage angles) can be saved and recalled. The narrow<br />
window at the bottom to the left views the information. Use the Save (button with<br />
arrow on the right) or Recall (button with arrow on the left). This feature allows<br />
quick comparison without saving and opening the project under different names.<br />
© SLS Loudspeakers, 2005<br />
<strong>LASS</strong>MN-040105<br />
14