LASS user manual - audio concepts
LASS user manual - audio concepts
LASS user manual - audio concepts

Create successful ePaper yourself
Turn your PDF publications into a flip-book with our unique Google optimized e-Paper software.
Starts<br />
Mapping<br />
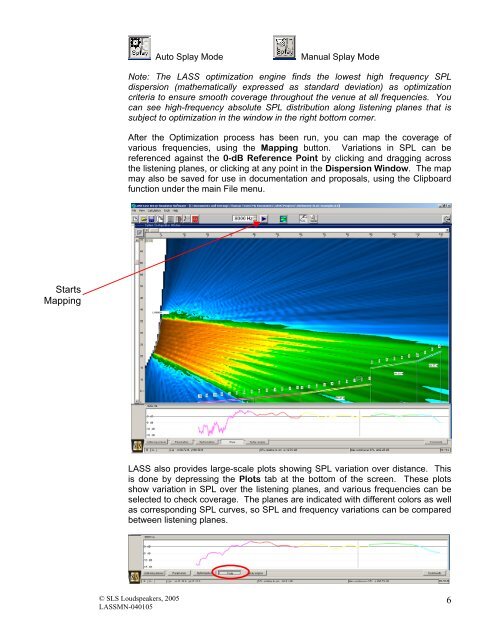
Auto Splay Mode Manual Splay Mode<br />
Note: The <strong>LASS</strong> optimization engine finds the lowest high frequency SPL<br />
dispersion (mathematically expressed as standard deviation) as optimization<br />
criteria to ensure smooth coverage throughout the venue at all frequencies. You<br />
can see high-frequency absolute SPL distribution along listening planes that is<br />
subject to optimization in the window in the right bottom corner.<br />
After the Optimization process has been run, you can map the coverage of<br />
various frequencies, using the Mapping button. Variations in SPL can be<br />
referenced against the 0-dB Reference Point by clicking and dragging across<br />
the listening planes, or clicking at any point in the Dispersion Window. The map<br />
may also be saved for use in documentation and proposals, using the Clipboard<br />
function under the main File menu.<br />
<strong>LASS</strong> also provides large-scale plots showing SPL variation over distance. This<br />
is done by depressing the Plots tab at the bottom of the screen. These plots<br />
show variation in SPL over the listening planes, and various frequencies can be<br />
selected to check coverage. The planes are indicated with different colors as well<br />
as corresponding SPL curves, so SPL and frequency variations can be compared<br />
between listening planes.<br />
© SLS Loudspeakers, 2005<br />
<strong>LASS</strong>MN-040105<br />
6