LASS user manual - audio concepts
LASS user manual - audio concepts
LASS user manual - audio concepts

Create successful ePaper yourself
Turn your PDF publications into a flip-book with our unique Google optimized e-Paper software.
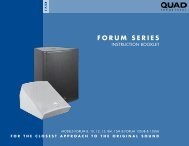
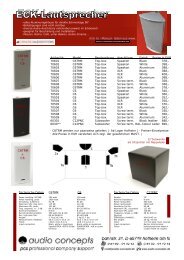
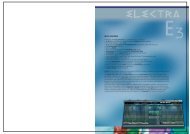
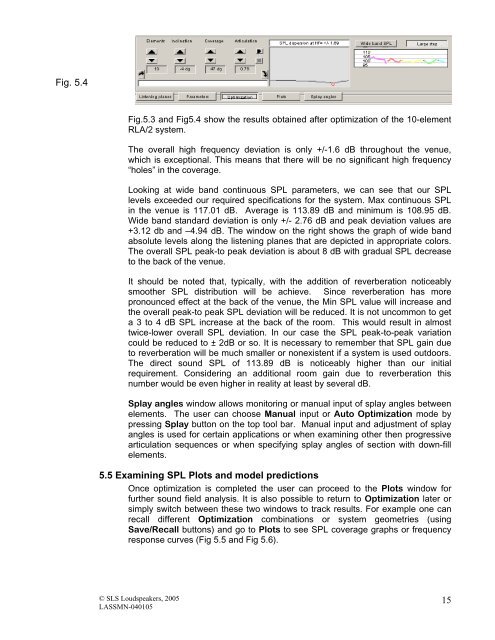
Fig. 5.4<br />
Fig.5.3 and Fig5.4 show the results obtained after optimization of the 10-element<br />
RLA/2 system.<br />
The overall high frequency deviation is only +/-1.6 dB throughout the venue,<br />
which is exceptional. This means that there will be no significant high frequency<br />
“holes” in the coverage.<br />
Looking at wide band continuous SPL parameters, we can see that our SPL<br />
levels exceeded our required specifications for the system. Max continuous SPL<br />
in the venue is 117.01 dB. Average is 113.89 dB and minimum is 108.95 dB.<br />
Wide band standard deviation is only +/- 2.76 dB and peak deviation values are<br />
+3.12 db and –4.94 dB. The window on the right shows the graph of wide band<br />
absolute levels along the listening planes that are depicted in appropriate colors.<br />
The overall SPL peak-to peak deviation is about 8 dB with gradual SPL decrease<br />
to the back of the venue.<br />
It should be noted that, typically, with the addition of reverberation noticeably<br />
smoother SPL distribution will be achieve. Since reverberation has more<br />
pronounced effect at the back of the venue, the Min SPL value will increase and<br />
the overall peak-to peak SPL deviation will be reduced. It is not uncommon to get<br />
a 3 to 4 dB SPL increase at the back of the room. This would result in almost<br />
twice-lower overall SPL deviation. In our case the SPL peak-to-peak variation<br />
could be reduced to ± 2dB or so. It is necessary to remember that SPL gain due<br />
to reverberation will be much smaller or nonexistent if a system is used outdoors.<br />
The direct sound SPL of 113.89 dB is noticeably higher than our initial<br />
requirement. Considering an additional room gain due to reverberation this<br />
number would be even higher in reality at least by several dB.<br />
Splay angles window allows monitoring or <strong>manual</strong> input of splay angles between<br />
elements. The <strong>user</strong> can choose Manual input or Auto Optimization mode by<br />
pressing Splay button on the top tool bar. Manual input and adjustment of splay<br />
angles is used for certain applications or when examining other then progressive<br />
articulation sequences or when specifying splay angles of section with down-fill<br />
elements.<br />
5.5 Examining SPL Plots and model predictions<br />
Once optimization is completed the <strong>user</strong> can proceed to the Plots window for<br />
further sound field analysis. It is also possible to return to Optimization later or<br />
simply switch between these two windows to track results. For example one can<br />
recall different Optimization combinations or system geometries (using<br />
Save/Recall buttons) and go to Plots to see SPL coverage graphs or frequency<br />
response curves (Fig 5.5 and Fig 5.6).<br />
© SLS Loudspeakers, 2005<br />
<strong>LASS</strong>MN-040105<br />
15