Nonparametric Bayesian Discrete Latent Variable Models for ...
Nonparametric Bayesian Discrete Latent Variable Models for ...
Nonparametric Bayesian Discrete Latent Variable Models for ...

You also want an ePaper? Increase the reach of your titles
YUMPU automatically turns print PDFs into web optimized ePapers that Google loves.
P1<br />
P2<br />
P3<br />
A1<br />
A2<br />
A3<br />
M1<br />
M2<br />
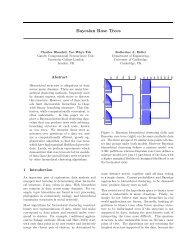
4.5 A Choice Model with Infinitely Many <strong>Latent</strong> Features<br />
politician<br />
athlete<br />
movie star<br />
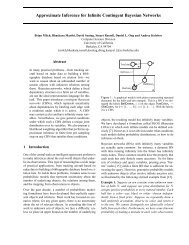
M3 P1 P2 P3 A1 A2 A3 M1 M2 M3<br />
Figure 4.16: Representation of the assumed features <strong>for</strong> the celebrities data. The tree structure<br />
on the right shows nine celebrities of three professions. Each individual is assumed<br />
to have a unique feature and one feature that he shares with the other celebrities<br />
that have the same profession. The left panel shows this assumed feature matrix<br />
which is used <strong>for</strong> training the tEBA model.<br />
many latent features (iEBA).<br />
We compare the predictive per<strong>for</strong>mance of each model using a leave-one-out scenario.<br />
We train the models on the data of all possible pairwise comparisons except one pair.<br />
We then predict the choice probability <strong>for</strong> the pair that was left out and repeat this<br />
procedure <strong>for</strong> all pairs. We evaluate the per<strong>for</strong>mance of the models using the loss<br />
function L( ˆ θ, θ) = −θlog ˆ θ − (1 − θ)log(1 − ˆ θ) which expresses the discrepancy between<br />
the true probabilities θ and the predicted probabilities ˆ θ. The mean of the predicted<br />
probabilities minimizes the expected loss. There<strong>for</strong>e we take this as a point estimate<br />
and report the negative log likelihood on the mean of the predictive distribution <strong>for</strong><br />
each pair.<br />
The negative log likelihood of each model averaged over the 36 pairs is shown in<br />
Table 4.2. For better comparison we also report the values <strong>for</strong> a baseline model that<br />
always predicts 0.5 and the upper bound that could be reached by predicting the empirical<br />
probabilities exactly. Furthermore, to see how much in<strong>for</strong>mation we gain over<br />
the baseline model by using the different models we report an in<strong>for</strong>mation score <strong>for</strong><br />
each single paired comparison: The negative log likelihood averaged over the pairs and<br />
number of comparisons in bits with the baseline model subtracted.<br />
The choice set was designed with the tree structure in mind. As expected, the BTL<br />
model cannot capture as much in<strong>for</strong>mation as the other models. The iEBA and the<br />
tEBA models have the best predictive per<strong>for</strong>mance on average. This shows that the<br />
underlying structure could be successfully represented by the infinite model. However,<br />
we cannot observe the tree structure in the latent features that are found by the iEBA.<br />
Note that different feature representations can lead to the same choice probabilities.<br />
The mean number of active features <strong>for</strong> the iEBA model <strong>for</strong> different pairs is between<br />
30 and 50—much more than the number of features in tEBA. This explains why the<br />
average per<strong>for</strong>mance of EBA12 and EBA15 is worse than that of iEBA and tEBA even<br />
though they could implement the tree structure in principle. As we cannot know how<br />
109