Nonparametric Bayesian Discrete Latent Variable Models for ...
Nonparametric Bayesian Discrete Latent Variable Models for ...
Nonparametric Bayesian Discrete Latent Variable Models for ...

You also want an ePaper? Increase the reach of your titles
YUMPU automatically turns print PDFs into web optimized ePapers that Google loves.
α<br />
G o<br />
G<br />
θi<br />
x<br />
i<br />
N<br />
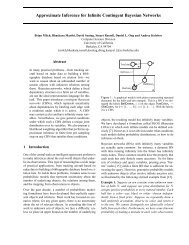
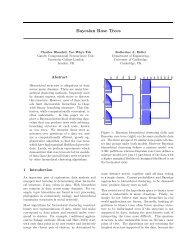
3.1 The Dirichlet Process<br />
Figure 3.1: Graphical representation of a Dirichlet process mixture model. The data is assumed<br />
to be generated from a distribution parameterized by θ. The distribution of the parameter<br />
θ has a Dirichlet process prior with base distribution G0 and concentration<br />
parameter α.<br />
i. Gn converges almost surely as n → ∞ to a random discrete distribution G.<br />
ii. G has DP (α, G0) distribution.<br />
iii. The sequence {θi} n 1<br />
is a sample from G.<br />
Note that eq. (3.7) gives an expression <strong>for</strong> generating samples from G, which is infinite<br />
dimensional, without having to represent it explicitly. The graphical representation of<br />
the DPM model corresponding to this representation is depicted in Figure 3.2 .<br />
The evolution of Gn with increasing number of samples is shown in Figure 3.3 <strong>for</strong><br />
a Pólya urn sequence with a Gaussian base distribution and α = 5. Note that the<br />
contribution of G0 to the distribution of Gn gets smaller as the number of samples<br />
increases, and it vanishes <strong>for</strong> large sample sizes.<br />
The generalized Pólya urn scheme shows that the draws from a DP exhibit a clustering<br />
property by the fact that a new sample has positive probability of being equal to one<br />
of the previous samples, and that the more often a color is sampled, the more likely it<br />
will be drawn again. Note that α determines the probability of choosing a new color.<br />
For small values of α, Gn has only a few atoms whereas <strong>for</strong> large values, the atoms are<br />
numerous, concentrating on the G0 distribution. This is illustrated in Figure 3.3 using<br />
α = 1 and α = 100.<br />
13