Nonparametric Bayesian Discrete Latent Variable Models for ...
Nonparametric Bayesian Discrete Latent Variable Models for ...
Nonparametric Bayesian Discrete Latent Variable Models for ...

Create successful ePaper yourself
Turn your PDF publications into a flip-book with our unique Google optimized e-Paper software.
4 Indian Buffet Process <strong>Models</strong><br />
tEBA<br />
15<br />
10<br />
5<br />
NLL<br />
5 10<br />
BTL<br />
15<br />
iEBA<br />
15<br />
10<br />
5<br />
NLL<br />
5 10<br />
BTL<br />
15<br />
tEBA<br />
15<br />
10<br />
5<br />
NLL<br />
5 10<br />
iEBA<br />
15<br />
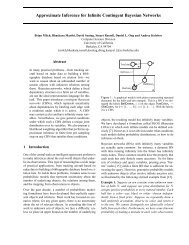
Figure 4.17: The negative log likelihood of one model versus another. Each point corresponds<br />
to one paired comparison.<br />
Table 4.2: Predictive per<strong>for</strong>mance of different models: The baseline model that always predicts<br />
a probability of 0.5 (BASE), the Bradley-Terry-Luce model (BTL), the finite<br />
EBA model with 12 features (EBA12), finite EBA model with 15 features (EBA15),<br />
EBA model with tree structure (tEBA), the EBA model with IBP prior (iEBA), and<br />
<strong>for</strong> comparison the empirical probabilities (EMP). NLL: The negative log likelihood<br />
values on the mean predictive probabilities. IS: In<strong>for</strong>mation score in bits (the in<strong>for</strong>mation<br />
gain compared to the model that always predicts 0.5). NLL and IS both<br />
express the same values in different scales.<br />
model NLL IS<br />
BASE 17.57 0<br />
BTL 4.66 0.0795<br />
EBA12 4.50 0.0806<br />
EBA15 4.31 0.0817<br />
tEBA 3.95 0.0839<br />
iEBA 3.92 0.0841<br />
EMP 2.89 0.0905<br />
many features will be necessary be<strong>for</strong>ehand this is a strong argument in the favor of<br />
using a non-parametric prior.<br />
Figure 4.17 shows a more fine-grained analysis of the BTL, tEBA and iEBA models.<br />
Each point corresponds to one paired comparison: the negative log likelihood of one<br />
model versus the negative log likelihood of another model. Out of 36 pairs BTL has a<br />
smaller log likelihood <strong>for</strong> 23 of the pairs when compared to tEBA and 26 when compared<br />
to iEBA. However, it can be seen that the bad per<strong>for</strong>mance of the BTL model on average<br />
is also due to the fact that it cannot capture the probabilities of some pairs at all. The<br />
iEBA and tEBA likelihoods are comparable although there are some pairs on which<br />
iEBA per<strong>for</strong>ms better than tEBA, and vice versa.<br />
110