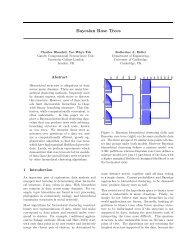
Nonparametric Bayesian Discrete Latent Variable Models for ...
Nonparametric Bayesian Discrete Latent Variable Models for ...
Nonparametric Bayesian Discrete Latent Variable Models for ...

You also want an ePaper? Increase the reach of your titles
YUMPU automatically turns print PDFs into web optimized ePapers that Google loves.
autocovariance coefficient<br />
1<br />
0.8<br />
0.6<br />
0.4<br />
0.2<br />
0<br />
spirals<br />
0 125<br />
iteration lag time<br />
250<br />
3.3 Empirical Study on the Choice of the Base Distribution<br />
autocovariance coefficient<br />
1<br />
0.8<br />
0.6<br />
0.4<br />
0.2<br />
0<br />
iris<br />
0 1250<br />
iteration lag time<br />
2500<br />
autocovariance coefficient<br />
1<br />
0.8<br />
0.6<br />
0.4<br />
0.2<br />
0<br />
wine<br />
SampleS<br />
SampleMu<br />
SampleBoth<br />
CDP<br />
0 25000<br />
iteration lag time<br />
50000<br />
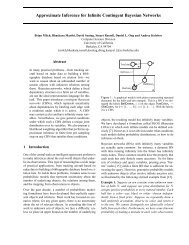
Figure 3.13: Autocorrelation coefficients of the number of active components <strong>for</strong> CDP and different<br />
sampling schemes <strong>for</strong> CCDP, <strong>for</strong> the Spiral data based on 5 × 10 5 iterations,<br />
the Iris data based on 10 6 iterations and Wine data based on 1.5 × 10 6 iterations.<br />
would need to <strong>for</strong>m a confusion matrix showing the frequency of each data pair being<br />
assigned to the same component <strong>for</strong> the entire Markov chain.<br />
Class labels are avaliable <strong>for</strong> the Iris and Wine data sets, both data sets consisting<br />
of 3 classes. The CDP model has 3-4 active components <strong>for</strong> the Iris data and 3 active<br />
components <strong>for</strong> the Winedata. The assignment of data points to the components shows<br />
successful clustering. The CCDP model has more components on average <strong>for</strong> both data<br />
sets, but data points with different labels are not assigned to the same component,<br />
resulting in successful clustering. The Spiral data set is generated by sampling 5 points<br />
<strong>for</strong>m each of the 160 Gaussians whose means lie on a spiral. For this data, the number<br />
of active components of CDP and CCDP do not go beyond 21 and 28, respectively.<br />
This is due to the assumption of independence of component means <strong>for</strong> both models,<br />
which does not hold <strong>for</strong> this data set. The data has been generated from clusters whose<br />
means lie on a spiral. The distribution of the number of active components <strong>for</strong> the<br />
Table 3.1: Average leave one out log-predictive densities <strong>for</strong> kernel density estimation (KDE),<br />
conjugate DP mixture model (CDP), conditionally conjugate DP mixture model<br />
(CCDP) on different data sets. The ratio of the average probability of the DP model<br />
vs the KDE model is given in parenthesis. Note the increase in discrepancy as the<br />
data dimension increases.<br />
Data set KDE CDP CCDP<br />
Geyser -1.9058 -1.9023(1.003) -1.8785(1.028)<br />
Spiral -7.2052 -7.1228(1.086) -7.1165(1.093)<br />
Iris -1.8599 -1.5769(1.327) -1.5460(1.369)<br />
Wine -18.9788 -17.5946(3.99) -17.3409(5.15)<br />
49