Nonparametric Bayesian Discrete Latent Variable Models for ...
Nonparametric Bayesian Discrete Latent Variable Models for ...
Nonparametric Bayesian Discrete Latent Variable Models for ...

Create successful ePaper yourself
Turn your PDF publications into a flip-book with our unique Google optimized e-Paper software.
# of components<br />
# of components<br />
# of components<br />
25<br />
20<br />
15<br />
10<br />
3.4 Dirichlet Process Mixtures of Factor Analyzers<br />
5<br />
0<br />
250<br />
2500 5000<br />
iterations<br />
7500 10000<br />
200<br />
150<br />
100<br />
50<br />
450<br />
300<br />
0 2500 5000<br />
iterations<br />
7500 10000<br />
0 250 500<br />
iterations<br />
750 1000<br />
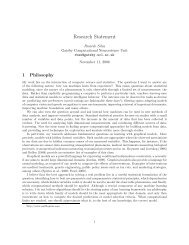
Figure 3.20: Change in the number of active components over the iterations <strong>for</strong> the DPMFA<br />
model using the peak-to-peak amplitudes (top), the 12 PCA components (middle)<br />
and the whole wave<strong>for</strong>ms (bottom) with the parameter α fixed to 1.<br />
probability of proposing new components. To check the effect of this, we also did runs<br />
with fixed α using the PCA projections. Recall that <strong>for</strong> the run on the 12 dimensions<br />
where α was updated, the number of active components first increased to 400, converging<br />
to around 80 components after 2000 iterations, see Figure 3.19. Interestingly, we observe<br />
the similar behavior even when α is fixed to 1, see Figure 3.20. For this case, the number<br />
of components increases to 250, and converges to around 40 after 1000 iterations <strong>for</strong> the<br />
12 dimensional representation. For the 112 dimensional representation, the number of<br />
components initially goes up to 500, and settles around 300 after 100 iterations.<br />
Although the number of active components is as high as 300, there are generally only<br />
10 components with more than 5 data points. Figure 3.18 shows that the clustering<br />
generally agrees with the results of the other experiments. We show the manual clustering<br />
results in Figure 3.21 and the DPMFA results using the whole wave<strong>for</strong>ms as inputs<br />
in Figure 3.22 <strong>for</strong> comparison. Note that the DPMFA finds a similar clustering <strong>for</strong> most<br />
of the data, except separating one of the big clusters into three.<br />
Superimposed spike wave<strong>for</strong>ms from each of the big clusters found by the DPMFA<br />
model are depicted in Figure 3.23. The wave<strong>for</strong>ms from the three clusters c1, c2 and c3<br />
were assumed to belong to one big cluster in manual clustering since they have similar<br />
amplitude characteristics. Attending to the shape of the wave<strong>for</strong>ms reveals that they<br />
61