Review of Greenland Avtivities 2001 - Geus
Review of Greenland Avtivities 2001 - Geus
Review of Greenland Avtivities 2001 - Geus

You also want an ePaper? Increase the reach of your titles
YUMPU automatically turns print PDFs into web optimized ePapers that Google loves.
Table 1. Temporal distribution <strong>of</strong> the images used for the determination <strong>of</strong> the glacier margin position<br />
Image source<br />
Image date<br />
Aerial<br />
photography<br />
CORONA<br />
satellites<br />
Landsat 2<br />
(channel 3)<br />
Landsat 5<br />
(channel 3)<br />
Landsat 7<br />
(channel 3)<br />
05.09.1953<br />
21.07.1965<br />
21.08.1967<br />
09.06.1979<br />
09.07.1979<br />
26.08.1980<br />
17.07.1993<br />
14.07.1995<br />
04.08.2000<br />
x (1.5 m)<br />
x (~ 3 m)<br />
x (~ 3 m)<br />
x (80 m)<br />
x (80 m)<br />
x (80 m)<br />
x (80 m)<br />
x (80 m)<br />
x (30 m)<br />
Pixel resolution is given in brackets<br />
In order to measure ablation automatically over several<br />
years without having to re-drill stakes at every visit,<br />
a new system was installed at the lower AMS. This consists<br />
<strong>of</strong> a ventilated stainless steel pressure transducer<br />
connected to a 20 m fibre-reinforced PVC hose filled<br />
with alcohol.<br />
At the revisit to the site in September <strong>2001</strong> the new<br />
ablation system was still functioning, and the recordings<br />
from the logger are in very good agreement with<br />
data from the sonic ranger and the classically measured<br />
melting <strong>of</strong> 4.95 m in 106 days.<br />
The positions <strong>of</strong> both AMSs and stakes were remeasured<br />
by a high-precision GPS receiver on the September<br />
visit, except for stake no. 750. The analysis <strong>of</strong> the measurements<br />
shows a velocity <strong>of</strong> the upper station <strong>of</strong> 0.4<br />
m/day, increasing downstream to 1.4 m/day at the<br />
lower station close to the glacier front. Data records for<br />
temperature and wind speed at both stations during<br />
the summer <strong>of</strong> <strong>2001</strong> are shown in Fig. 3. Both parameters<br />
are generally in phase for the two stations, but temperature<br />
inversions can be found on days with very low<br />
wind speed at the lower station. The data sets for the<br />
stations will be used for further analysis <strong>of</strong> melting conditions<br />
and the distribution <strong>of</strong> melting in this area.<br />
During the <strong>2001</strong> field season the NASA airborne ice<br />
radar and laser altimetry system was used for investigations<br />
in southern <strong>Greenland</strong> within the PARCA project.<br />
By request, one flight track was planned to cover<br />
the GEUS glaciological transect (Fig. 1). Unfortunately,<br />
the ice radar data could not provide thickness data over<br />
this track because <strong>of</strong> heavily crevassed and irregular surface<br />
conditions. However, the laser altimetry data are<br />
<strong>of</strong> very good quality, and are currently being analysed<br />
in combination with the GPS measurements and information<br />
from the satellite images.<br />
Glacier-margin detection from satellite<br />
imagery<br />
During the past 50 years the glacier Sermilik Bræ has<br />
undergone significant variations in its dimensions. Within<br />
A<br />
B<br />
N<br />
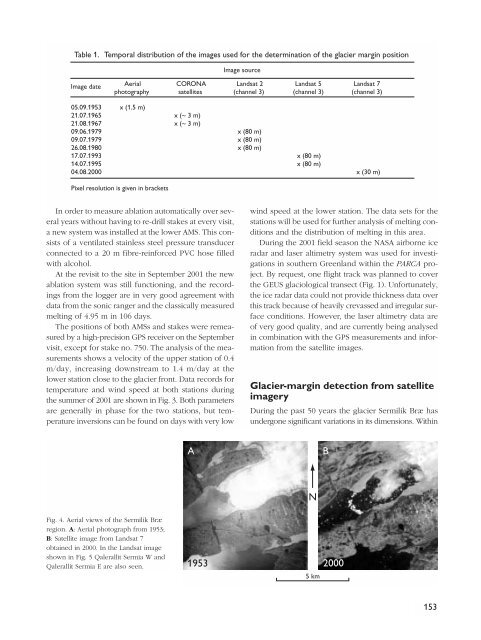
Fig. 4. Aerial views <strong>of</strong> the Sermilik Bræ<br />
region. A: Aerial photograph from 1953;<br />
B: Satellite image from Landsat 7<br />
obtained in 2000. In the Landsat image<br />
shown in Fig. 5 Qalerallit Sermia W and<br />
Qalerallit Sermia E are also seen.<br />
1953 2000<br />
5 km<br />
153