Review of Greenland Avtivities 2001 - Geus
Review of Greenland Avtivities 2001 - Geus
Review of Greenland Avtivities 2001 - Geus

Create successful ePaper yourself
Turn your PDF publications into a flip-book with our unique Google optimized e-Paper software.
have a reducing effect, which hinders the formation <strong>of</strong><br />
magnetite. As was the case for the amphibolites, the<br />
negative tail <strong>of</strong> the distribution possibly reflects weathered<br />
rocks.<br />
Marble<br />
Marbles from five localities are very similar, all with<br />
very low susceptibility values (Fig. 4E) due to the high<br />
content <strong>of</strong> non-magnetic calc-silicate minerals. The<br />
highest values for marble were obtained at one locality<br />
where the marble contained thin intercalated mafic<br />
mica schist bands and was penetrated by pegmatite<br />
veins. In general, the magnetic susceptibility is almost<br />
negligible, and the marble lithologies can thus be<br />
considered as forming non-magnetic units.<br />
Intrusive rocks: Arfersiorfik quartz diorite<br />
Susceptibility values were taken at six outcrops <strong>of</strong> the<br />
Arfersiorfik quartz diorite, and fall into two groups<br />
(Fig. 4F). The first group has high values ranging from<br />
0.69 to 6.88 x 10 –3 SI, while the second group has<br />
lower values between 0.01 and 1.10 x 10 –3 SI. Field<br />
observations indicate that the quartz diorite varies in<br />
appearance from dark to light coloured types, due to<br />
varying amounts <strong>of</strong> mafic components, quartz content<br />
and grain size, which may explain the variance <strong>of</strong> the<br />
susceptibility values.<br />
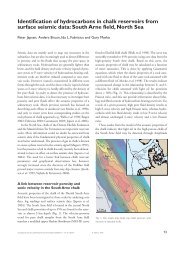
Magnetic pr<strong>of</strong>ile data<br />
The NNW–SSE pr<strong>of</strong>ile measured from the eastern<br />
inland camp south <strong>of</strong> Ussuit is perpendicular to the<br />
southern border <strong>of</strong> the Nordre Isortoq steep belt (line<br />
C to D in Figs 3, 5). The pr<strong>of</strong>ile runs from the low<br />
magnetic zone <strong>of</strong> the steep belt into a more irregular<br />
high magnetic anomaly zone. The pr<strong>of</strong>ile was laid out<br />
as a straight line, with start and end points together<br />
with every 100 m interval determined by use <strong>of</strong> the<br />
Global Positioning System (GPS).<br />
The central part <strong>of</strong> this ground pr<strong>of</strong>ile crosses a small<br />
positive anomaly. One <strong>of</strong> the aims was to compare the<br />
details obtained from the ground measurements with a<br />
pr<strong>of</strong>ile from the Aeromag 1999 survey (Rasmussen &<br />
van Gool 2000). The airborne magnetic pr<strong>of</strong>ile was<br />
flown at an altitude <strong>of</strong> 300 m, runs N–S and intersects<br />
the ground pr<strong>of</strong>ile (Fig. 5). The difference in content<br />
<strong>of</strong> short wavelength anomalies in the two survey types<br />
(Fig. 5) clearly illustrates the attenuation with increased<br />
distance to the sources, which has significant implications<br />
for the amount <strong>of</strong> detail that can be acquired<br />
from the airborne data. However, a clear correlation<br />
with the observed surface geology is confirmed by the<br />
ground pr<strong>of</strong>ile.<br />
The sharp positive anomalies observed in the<br />
central part <strong>of</strong> the ground pr<strong>of</strong>ile correlate with a<br />
100–150 m wide zone containing ultramafic rocks,<br />
whereas the lower magnetic anomalies reflect gneiss<br />
lithologies. The locations <strong>of</strong> the lowest anomalies can<br />
be related to calc-silicate horizons observed in the<br />
field. Based on these observations it can be concluded<br />
that the small positive anomaly in the aeromagnetic<br />
data originates from the presence <strong>of</strong> ultramafic rocks.<br />
Combined forward modelling and inversion undertaken<br />
with tabular bodies as the principal model is<br />
shown in Fig. 6 for both the ground and airborne<br />
pr<strong>of</strong>ile. The free parameters in the final inversion are<br />
location, size, thickness and magnetic properties.<br />
Some initial modelling with the dip angle as free parameter<br />
indicates that a steep northward dip <strong>of</strong> the<br />
bodies gave the best data-fit. In the final inversion the<br />
dip angles for all bodies were identical, except one<br />
body for which it was necessary to deviate slightly<br />
from the common angle in order to obtain a proper<br />
data-fit. The relatively thin alternating bodies <strong>of</strong> rocks<br />
with different magnetic properties, necessary in the<br />
modelling, reflect the banded nature <strong>of</strong> the geology in<br />
the study region.<br />
To test the agreement <strong>of</strong> the field susceptibility<br />
measurements with the values obtained by the modelling,<br />
the modelling was undertaken without any constraints<br />
on the magnetic properties, but with the<br />
assumption that the direction <strong>of</strong> magnetisation was<br />
aligned along the present direction <strong>of</strong> the geomagnetic<br />
field. Thus the modelling does not distinguish between<br />
a remanent magnetisation in the direction <strong>of</strong> the geomagnetic<br />
field and the induced magnetic component.<br />
The magnetic susceptibility values for the bodies in the<br />
modelling range from 0 to 92 x 10 -3 , with a mean around<br />
30 x 10 -3 . This is one order <strong>of</strong> magnitude higher than<br />
the geometric mean values <strong>of</strong> the measured susceptibility<br />
values, but within the range obtained from the<br />
measured values. An explanation to this discrepancy<br />
may be that the remanent magnetic component contributes<br />
considerably to magnetisation; however, this<br />
has not been confirmed by laboratory measurements<br />
on rock sample from the Survey’s archive.<br />
Although modelling <strong>of</strong> potential field data is known<br />
to be highly ambiguous, the model presented above<br />
includes features that are expected to be common to all<br />
54