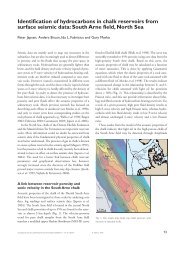
Review of Greenland Avtivities 2001 - Geus
Review of Greenland Avtivities 2001 - Geus
Review of Greenland Avtivities 2001 - Geus

You also want an ePaper? Increase the reach of your titles
YUMPU automatically turns print PDFs into web optimized ePapers that Google loves.
Effects <strong>of</strong> the tsunami<br />
The tsunami generated by the landslide affected not<br />
only Saqqaq but, as noted above, also the abandoned<br />
coal mining village <strong>of</strong> Qullissat 20 km across the fjord<br />
where buildings at altitudes below 30 m a.s.l. were<br />
almost completely destroyed. A line <strong>of</strong> timber debris<br />
100–250 m from the coast marks the upper limit <strong>of</strong> the<br />
tsunami. A hut on the shore at Asuk 20 km from<br />
Paatuut (Fig. 2) was completely destroyed.<br />
On the large alluvial fan at the outlet from Ataata<br />
Kuua 7 km north-west <strong>of</strong> Paatuut, several icebergs<br />
were stranded 300–700 m from the coast. Wreckage,<br />
including fish crates, was scattered across the alluvial<br />
fan up to 800 m inland and at altitudes up to 40 m<br />
a.s.l., and in the summer <strong>of</strong> <strong>2001</strong> certain vegetation<br />
species in the same area had withered, presumably<br />
due to saltwater incursion.<br />
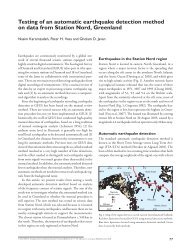
Seismic activity<br />
A seismometer at Qeqertarsuaq registered a distinct<br />
seismic signal on 21 November 2000 at 15:05:10 local<br />
time (Fig. 6). People in Saqqaq noted that the tsunami<br />
arrived at 15:15, and the seismic signal is thus clearly<br />
related either to the landslide itself or to an earthquake<br />
which triggered the landslide. Seismic stations at<br />
Upernavik c. 250 km north <strong>of</strong> Paatuut and at Summit,<br />
the drilling camp at the centre <strong>of</strong> the Inland Ice c. 550<br />
km to the east (Fig. 2), also registered a seismic event<br />
on 21 November 2000 (Fig. 6). An analysis <strong>of</strong> the seismic<br />
records suggests that a seismic event occurred at<br />
15:04:52 at Paatuut, and that it was probably caused by<br />
the release <strong>of</strong> the basaltic cliff at the head <strong>of</strong> the slide<br />
(Pedersen et al. <strong>2001</strong>). This event is seen as the arrival<br />
<strong>of</strong> the primary wave (P) and secondary and surface<br />
waves (S and Lg) at all stations (Fig. 6). The following<br />
stronger signal reflects the surface waves generated by<br />
the activity <strong>of</strong> the avalanche, estimated to have a<br />
magnitude <strong>of</strong> 2.3 on the Richter scale. The constant<br />
time difference between the surface waves from the<br />
first and the second events at seismic stations at<br />
increasing distances from Paatuut indicates that the two<br />
seismic signals were generated at Paatuut, separated by<br />
approximately one minute. The main slide event was<br />
accomplished within approximately 80 seconds. With<br />
an average slide distance <strong>of</strong> 3 km, this implies an average<br />
slide velocity <strong>of</strong> 140 km/h. Maximum velocities<br />
would have been close to 200 km/h.<br />
The analysis <strong>of</strong> the seismic signals does not support<br />
the hypothesis that a deep-seated earthquake generated<br />
Fig. 6. Seismic events related to the rock<br />
fall and landslide at Paatuut 21 November<br />
2000 recorded at Qeqertarsuaq, Upernavik<br />
and Summit (Fig. 2). The red lines mark<br />
the calculated arrival times <strong>of</strong> P (primary),<br />
S (secondary), and Lg (surface) waves<br />
from an initial release event at Paatuut.<br />
The time is determined by interpreting<br />
the P arrival at Qeqertarsuaq. The initial<br />
release <strong>of</strong> the fall occurred at 18:04:52<br />
GMT (15:04:52 local time) and generated<br />
P, S and Lg waves. Subsequently, the<br />
energy released by the sliding <strong>of</strong> 90<br />
million m 3 <strong>of</strong> rocks down onto the<br />
coastal slopes is visible as an additional<br />
surface wave culminating approximately<br />
one minute after the initial event. This<br />
second and much larger event – estimated<br />
at 2.3 on the Richter scale – is also<br />
visible in seismograms from Nuuk,<br />
Tasiilaq, Thule and possibly Alert in<br />
Canada. E, N and Z are the east–west,<br />
north–south and vertical components in<br />
the ground movements.<br />
7: SUM N<br />
(Summit)<br />
6: UPN E<br />
(Upernavik)<br />
5: UPN N<br />
(Upernavik)<br />
4: UPN Z<br />
(Upernavik)<br />
3: GDH E<br />
(Qeqertarsuaq)<br />
2: GDH N<br />
(Qeqertarsuaq)<br />
1: GDH Z<br />
(Qeqertarsuaq)<br />
-50<br />
frost crack<br />
15:04:52 local time<br />
upn P<br />
gdh P gdh S<br />
gdh Lg<br />
sum P<br />
upn S upn Lg<br />
1 min.<br />
1 min.<br />
sum S<br />
main slide<br />
sum Lg<br />
1 min.<br />
0 50<br />
100 150 200<br />
main slide<br />
main slide<br />
seconds<br />
79