Review of Greenland Avtivities 2001 - Geus
Review of Greenland Avtivities 2001 - Geus
Review of Greenland Avtivities 2001 - Geus

You also want an ePaper? Increase the reach of your titles
YUMPU automatically turns print PDFs into web optimized ePapers that Google loves.
A<br />
B<br />
N<br />
20 km<br />
1993 1995<br />
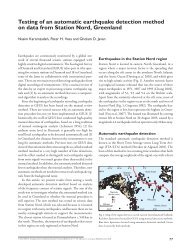
Fig. 5. Satellite images from Landsat 5 obtained in 1993 (A) and 1995 (B) showing changes <strong>of</strong> the snout <strong>of</strong> Sermilik Bræ. See also<br />
text and Table 1.<br />
the framework <strong>of</strong> the project, investigations are focused<br />
on the retreat <strong>of</strong> Sermilik Bræ and on the two branches<br />
<strong>of</strong> Qalerallit Sermia (formerly Qaleragdlit sermia, glacier<br />
code 1 AH 0<strong>2001</strong>, Weidick et al. 1992), the glacier<br />
to the east (Fig. 1). The retreat <strong>of</strong> these glaciers can be<br />
determined from aerial photography from 1953 and<br />
comparisons <strong>of</strong> satellite images from 1965, 1967, 1979,<br />
1980, 1993, 1995 and 2000. The satellite images were<br />
obtained from the CORONA satellite mission and from<br />
the continuous Landsat series, including images from<br />
Landsat 2, 5 and 7. Information about the available<br />
images and the channels used is given in Table 1. As<br />
an example, the pronounced retreat <strong>of</strong> Sermilik Bræ<br />
between 1953 and 2000 is illustrated in Fig. 4.<br />
The resolution <strong>of</strong> all images is better than 80 m,<br />
which allows a high-resolution determination <strong>of</strong> the<br />
glacier retreat over several kilometres. Identification <strong>of</strong><br />
between 20 to 40 ground control points over the area<br />
<strong>of</strong> interest in each <strong>of</strong> the images allows correlation <strong>of</strong><br />
all images with a master image, for which a Landsat 7<br />
image with a pixel resolution <strong>of</strong> 30 m was used. The<br />
measurements <strong>of</strong> glacier tongue variations were determined<br />
from central flow lines on the glaciers. For<br />
Qalerallit Sermia W and Qalerallit Sermia E retreat is<br />
measured with respect to 1965 as reference year.<br />
The earliest observations on Sermilik Bræ date from<br />
the mid-19th century, but there are insufficient records<br />
prior to 1947 to establish a continuous history <strong>of</strong> retreat<br />
or advance. Between 1947 and 1953, the glacier front <strong>of</strong><br />
Sermilik Bræ was reported as stationary (Weidick 1959),<br />
but since 1953 our observations indicate a semi-continuous<br />
retreat. This general trend has also been observed<br />
for nearby glaciers on the series <strong>of</strong> satellite images.<br />
However, an aerial photograph from 1985 shows the<br />
glacier front <strong>of</strong> Sermilik Bræ at almost the same position<br />
as it was in 1980, followed by a retreat once again.<br />
Satellite images from 1993 show that the tongue <strong>of</strong><br />
Sermilik Bræ was floating over several kilometres <strong>of</strong> the<br />
front at this time. The rate <strong>of</strong> retreat changed considerably<br />
between 1985 and 1993. The break up <strong>of</strong> a considerable<br />
part <strong>of</strong> the glacier tongue (Figs 4, 5) cannot yet<br />
be precisely dated. Between 1995 and 2000 retreat events<br />
sum up to about 1900 m at Sermilik Bræ (Fig. 6).<br />
Climatic effects, such as a general global warming,<br />
cannot account for the regional retreat <strong>of</strong> the glaciers<br />
in southern <strong>Greenland</strong>. Recent studies have shown that<br />
temperatures in western <strong>Greenland</strong> and adjacent regions<br />
in the North Atlantic have experienced a slight cooling<br />
over the last half century, in contrast to the global trend<br />
(Chapman & Walsh 1993; Hansen et al. in press). In<br />
agreement with these findings, meteorological observations<br />
at Nuuk and Narsarsuaq have also shown a<br />
cooling trend over the last 50 years. However, relatively<br />
warmer periods have been noted between 1940<br />
and 1950 and also during the 1980s and 1990s (Jørgensen<br />
<strong>2001</strong>). The latter short-term temperature increases may<br />
have led to higher melt rates, particularly at the ice-sheet<br />
margin, and may be linked to the rapid disintegration<br />
<strong>of</strong> the floating glacier tongue and an associated massive<br />
ice discharge observed at Sermilik Bræ between<br />
1993 and 1995 (Fig. 5A).<br />
The satellite images show an extensive moraine corresponding<br />
to the position <strong>of</strong> the last major glacier<br />
advance in the late 19th century, which extends through-<br />
154