Review of Greenland Avtivities 2001 - Geus
Review of Greenland Avtivities 2001 - Geus
Review of Greenland Avtivities 2001 - Geus

Create successful ePaper yourself
Turn your PDF publications into a flip-book with our unique Google optimized e-Paper software.
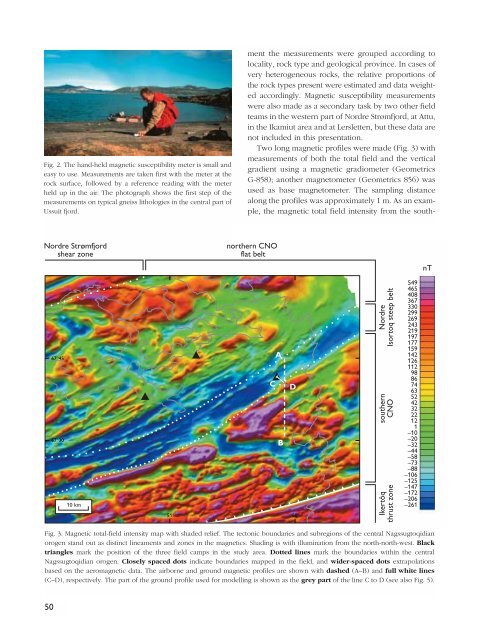
Fig. 2. The hand-held magnetic susceptibility meter is small and<br />
easy to use. Measurements are taken first with the meter at the<br />
rock surface, followed by a reference reading with the meter<br />
held up in the air. The photograph shows the first step <strong>of</strong> the<br />
measurements on typical gneiss lithologies in the central part <strong>of</strong><br />
Ussuit fjord.<br />
ment the measurements were grouped according to<br />
locality, rock type and geological province. In cases <strong>of</strong><br />
very heterogeneous rocks, the relative proportions <strong>of</strong><br />
the rock types present were estimated and data weighted<br />
accordingly. Magnetic susceptibility measurements<br />
were also made as a secondary task by two other field<br />
teams in the western part <strong>of</strong> Nordre Strømfjord, at Attu,<br />
in the Ikamiut area and at Lersletten, but these data are<br />
not included in this presentation.<br />
Two long magnetic pr<strong>of</strong>iles were made (Fig. 3) with<br />
measurements <strong>of</strong> both the total field and the vertical<br />
gradient using a magnetic gradiometer (Geometrics<br />
G-858); another magnetometer (Geometrics 856) was<br />
used as base magnetometer. The sampling distance<br />
along the pr<strong>of</strong>iles was approximately 1 m. As an example,<br />
the magnetic total field intensity from the south-<br />
Nordre Strømfjord<br />
shear zone<br />
northern CNO<br />
flat belt<br />
nT<br />
67°45´<br />
67°30´<br />
10 km<br />
A<br />
C D<br />
B<br />
51° 50°<br />
Nordre<br />
Isortoq steep belt<br />
southern<br />
CNO<br />
Ikertôq<br />
thrust zone<br />
549<br />
465<br />
408<br />
367<br />
330<br />
299<br />
269<br />
243<br />
219<br />
197<br />
177<br />
159<br />
142<br />
126<br />
112<br />
98<br />
86<br />
74<br />
63<br />
52<br />
42<br />
32<br />
22<br />
12<br />
1<br />
–10<br />
–20<br />
–32<br />
–44<br />
–58<br />
–73<br />
–88<br />
–106<br />
–125<br />
–147<br />
–172<br />
–206<br />
–261<br />
Fig. 3. Magnetic total-field intensity map with shaded relief. The tectonic boundaries and subregions <strong>of</strong> the central Nagssugtoqidian<br />
orogen stand out as distinct lineaments and zones in the magnetics. Shading is with illumination from the north-north-west. Black<br />
triangles mark the position <strong>of</strong> the three field camps in the study area. Dotted lines mark the boundaries within the central<br />
Nagssugtoqidian orogen. Closely spaced dots indicate boundaries mapped in the field, and wider-spaced dots extrapolations<br />
based on the aeromagnetic data. The airborne and ground magnetic pr<strong>of</strong>iles are shown with dashed (A–B) and full white lines<br />
(C–D), respectively. The part <strong>of</strong> the ground pr<strong>of</strong>ile used for modelling is shown as the grey part <strong>of</strong> the line C to D (see also Fig. 5).<br />
50