economic indicators - City of Greater Geelong
economic indicators - City of Greater Geelong
economic indicators - City of Greater Geelong

Create successful ePaper yourself
Turn your PDF publications into a flip-book with our unique Google optimized e-Paper software.
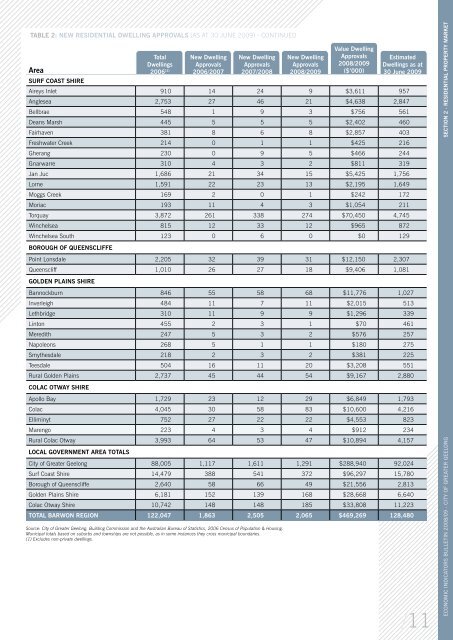
TABLE 2: New Residential Dwelling Approvals (as at 30 June 2009) - continued<br />
Area<br />
New Dwelling<br />
Total<br />
2006 (1) 2006/2007<br />
Dwellings Approvals<br />
New Dwelling<br />
Approvals<br />
2007/2008<br />
New Dwelling<br />
Approvals<br />
2008/2009<br />
Value Dwelling<br />
Approvals<br />
2008/2009<br />
($’000)<br />
Estimated<br />
Dwellings as at<br />
30 June 2009<br />
SURF COAST SHIRE<br />
Aireys Inlet 910 14 24 9 $3,611 957<br />
Anglesea 2,753 27 46 21 $4,638 2,847<br />
Bellbrae 548 1 9 3 $756 561<br />
Deans Marsh 445 5 5 5 $2,402 460<br />
Fairhaven 381 8 6 8 $2,857 403<br />
Freshwater Creek 214 0 1 1 $425 216<br />
Gherang 230 0 9 5 $466 244<br />
Gnarwarre 310 4 3 2 $811 319<br />
Jan Juc 1,686 21 34 15 $5,425 1,756<br />
Lorne 1,591 22 23 13 $2,195 1,649<br />
Moggs Creek 169 2 0 1 $242 172<br />
Moriac 193 11 4 3 $1,054 211<br />
Torquay 3,872 261 338 274 $70,450 4,745<br />
Winchelsea 815 12 33 12 $965 872<br />
Winchelsea South 123 0 6 0 $0 129<br />
BOROUGH OF QUEENSCLIFFE<br />
Point Lonsdale 2,205 32 39 31 $12,150 2,307<br />
Queenscliff 1,010 26 27 18 $9,406 1,081<br />
GOLDEN PLAINS SHIRE<br />
Bannockburn 846 55 58 68 $11,776 1,027<br />
Inverleigh 484 11 7 11 $2,015 513<br />
Lethbridge 310 11 9 9 $1,296 339<br />
Linton 455 2 3 1 $70 461<br />
Meredith 247 5 3 2 $576 257<br />
Napoleons 268 5 1 1 $180 275<br />
Smythesdale 218 2 3 2 $381 225<br />
Teesdale 504 16 11 20 $3,208 551<br />
Rural Golden Plains 2,737 45 44 54 $9,167 2,880<br />
COLAC OTWAY SHIRE<br />
Apollo Bay 1,729 23 12 29 $6,849 1,793<br />
Colac 4,045 30 58 83 $10,600 4,216<br />
Elliminyt 752 27 22 22 $4,553 823<br />
Marengo 223 4 3 4 $912 234<br />
Rural Colac Otway 3,993 64 53 47 $10,894 4,157<br />
LOCAL GOVERNMENT AREA TOTALS<br />
<strong>City</strong> <strong>of</strong> <strong>Greater</strong> <strong>Geelong</strong> 88,005 1,117 1,611 1,291 $288,940 92,024<br />
Surf Coast Shire 14,479 388 541 372 $96,297 15,780<br />
Borough <strong>of</strong> Queenscliffe 2,640 58 66 49 $21,556 2,813<br />
Golden Plains Shire 6,181 152 139 168 $28,668 6,640<br />
Colac Otway Shire 10,742 148 148 185 $33,808 11,223<br />
TOTAL BARWON REGION 122,047 1,863 2,505 2,065 $469,269 128,480<br />
Source: <strong>City</strong> <strong>of</strong> <strong>Greater</strong> <strong>Geelong</strong>, Building Commission and the Australian Bureau <strong>of</strong> Statistics, 2006 Census <strong>of</strong> Population & Housing.<br />
Municipal totals based on suburbs and townships are not possible, as in some instances they cross municipal boundaries.<br />
(1) Excludes non-private dwellings.<br />
/11<br />
<strong>economic</strong> <strong>indicators</strong> bulletin 2008/09 - city <strong>of</strong> greater geelong section 2 - residential property market