economic indicators - City of Greater Geelong
economic indicators - City of Greater Geelong
economic indicators - City of Greater Geelong

Create successful ePaper yourself
Turn your PDF publications into a flip-book with our unique Google optimized e-Paper software.
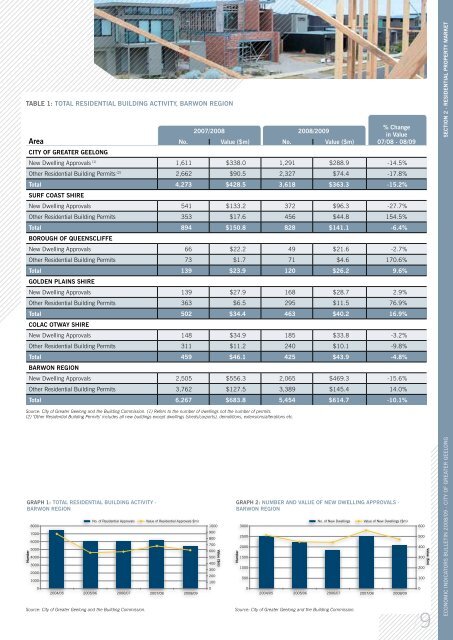
TABLE 1: Total Residential Building Activity, Barwon Region<br />
Area<br />
CITY OF GREATER GEELONG<br />
2007/2008 2008/2009<br />
No. Value ($m) No. Value ($m)<br />
% Change<br />
in Value<br />
07/08 - 08/09<br />
New Dwelling Approvals (1) 1,611 $338.0 1,291 $288.9 -14.5%<br />
Other Residential Building Permits (2) 2,662 $90.5 2,327 $74.4 -17.8%<br />
Total 4,273 $428.5 3,618 $363.3 -15.2%<br />
SURF COAST SHIRE<br />
New Dwelling Approvals 541 $133.2 372 $96.3 -27.7%<br />
Other Residential Building Permits 353 $17.6 456 $44.8 154.5%<br />
Total 894 $150.8 828 $141.1 -6.4%<br />
BOROUGH OF QUEENSCLIFFE<br />
New Dwelling Approvals 66 $22.2 49 $21.6 -2.7%<br />
Other Residential Building Permits 73 $1.7 71 $4.6 170.6%<br />
Total 139 $23.9 120 $26.2 9.6%<br />
GOLDEN PLAINS SHIRE<br />
New Dwelling Approvals 139 $27.9 168 $28.7 2.9%<br />
Other Residential Building Permits 363 $6.5 295 $11.5 76.9%<br />
Total 502 $34.4 463 $40.2 16.9%<br />
COLAC OTWAY SHIRE<br />
New Dwelling Approvals 148 $34.9 185 $33.8 -3.2%<br />
Other Residential Building Permits 311 $11.2 240 $10.1 -9.8%<br />
Total 459 $46.1 425 $43.9 -4.8%<br />
BARWON REGION<br />
New Dwelling Approvals 2,505 $556.3 2,065 $469.3 -15.6%<br />
Other Residential Building Permits 3,762 $127.5 3,389 $145.4 14.0%<br />
Total 6,267 $683.8 5,454 $614.7 -10.1%<br />
Source: <strong>City</strong> <strong>of</strong> <strong>Greater</strong> <strong>Geelong</strong> and the Building Commission. (1) Refers to the number <strong>of</strong> dwellings not the number <strong>of</strong> permits.<br />
(2) ‘Other Residential Building Permits’ includes all new buildings except dwellings (sheds/carports), demolitions, extensions/alterations etc.<br />
GRAPH 1: Total residential Building Activity -<br />
Barwon Region<br />
Number<br />
8000<br />
7000<br />
6000<br />
5000<br />
4000<br />
3000<br />
2000<br />
1000<br />
0<br />
No. <strong>of</strong> Residential Approvals<br />
2004/05 2005/06 2006/07 2007/08 2008/09<br />
Source: <strong>City</strong> <strong>of</strong> <strong>Greater</strong> <strong>Geelong</strong> and the Building Commission.<br />
Value <strong>of</strong> Residential Approvals $m)<br />
1000<br />
900<br />
800<br />
700<br />
600<br />
500<br />
400<br />
300<br />
200<br />
100<br />
0<br />
Value ($m)<br />
GRAPH 2: Number and Value <strong>of</strong> New Dwelling Approvals -<br />
Barwon Region<br />
Number<br />
3000<br />
2500<br />
2000<br />
1500<br />
1000<br />
500<br />
0<br />
No. <strong>of</strong> New Dwellings<br />
Source: <strong>City</strong> <strong>of</strong> <strong>Greater</strong> <strong>Geelong</strong> and the Building Commission.<br />
Value <strong>of</strong> New Dwellings ($m)<br />
2004/05 2005/06 2006/07 2007/08 2008/09<br />
600<br />
500<br />
400<br />
300<br />
200<br />
100<br />
0<br />
Value ($m)<br />
/9<br />
<strong>economic</strong> <strong>indicators</strong> bulletin 2008/09 - city <strong>of</strong> greater geelong section 2 - residential property market