economic indicators - City of Greater Geelong
economic indicators - City of Greater Geelong
economic indicators - City of Greater Geelong

You also want an ePaper? Increase the reach of your titles
YUMPU automatically turns print PDFs into web optimized ePapers that Google loves.
S4<br />
population growth<br />
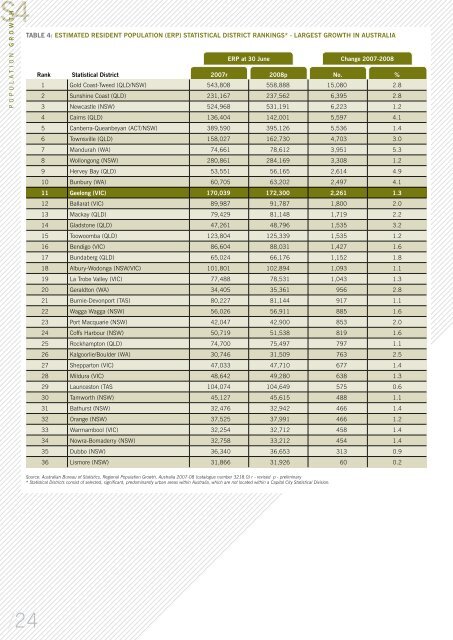
TABLE 4: Estimated Resident Population (ERP) Statistical District Rankings* - Largest Growth in Australia<br />
ERP at 30 June Change 2007-2008<br />
Rank Statistical District 2007r 2008p No. %<br />
1 Gold Coast-Tweed (QLD/NSW) 543,808 558,888 15,080 2.8<br />
2 Sunshine Coast (QLD) 231,167 237,562 6,395 2.8<br />
3 Newcastle (NSW) 524,968 531,191 6,223 1.2<br />
4 Cairns (QLD) 136,404 142,001 5,597 4.1<br />
5 Canberra-Queanbeyan (ACT/NSW) 389,590 395,126 5,536 1.4<br />
6 Townsville (QLD) 158,027 162,730 4,703 3.0<br />
7 Mandurah (WA) 74,661 78,612 3,951 5.3<br />
8 Wollongong (NSW) 280,861 284,169 3,308 1.2<br />
9 Hervey Bay (QLD) 53,551 56,165 2,614 4.9<br />
10 Bunbury (WA) 60,705 63,202 2,497 4.1<br />
11 <strong>Geelong</strong> (VIC) 170,039 172,300 2,261 1.3<br />
12 Ballarat (VIC) 89,987 91,787 1,800 2.0<br />
13 Mackay (QLD) 79,429 81,148 1,719 2.2<br />
14 Gladstone (QLD) 47,261 48,796 1,535 3.2<br />
15 Toowoomba (QLD) 123,804 125,339 1,535 1.2<br />
16 Bendigo (VIC) 86,604 88,031 1,427 1.6<br />
17 Bundaberg (QLD) 65,024 66,176 1,152 1.8<br />
18 Albury-Wodonga (NSW/VIC) 101,801 102,894 1,093 1.1<br />
19 La Trobe Valley (VIC) 77,488 78,531 1,043 1.3<br />
20 Geraldton (WA) 34,405 35,361 956 2.8<br />
21 Burnie-Devonport (TAS) 80,227 81,144 917 1.1<br />
22 Wagga Wagga (NSW) 56,026 56,911 885 1.6<br />
23 Port Macquarie (NSW) 42,047 42,900 853 2.0<br />
24 C<strong>of</strong>fs Harbour (NSW) 50,719 51,538 819 1.6<br />
25 Rockhampton (QLD) 74,700 75,497 797 1.1<br />
26 Kalgoorlie/Boulder (WA) 30,746 31,509 763 2.5<br />
27 Shepparton (VIC) 47,033 47,710 677 1.4<br />
28 Mildura (VIC) 48,642 49,280 638 1.3<br />
29 Launceston (TAS 104,074 104,649 575 0.6<br />
30 Tamworth (NSW) 45,127 45,615 488 1.1<br />
31 Bathurst (NSW) 32,476 32,942 466 1.4<br />
32 Orange (NSW) 37,525 37,991 466 1.2<br />
33 Warrnambool (VIC) 32,254 32,712 458 1.4<br />
34 Nowra-Bomaderry (NSW) 32,758 33,212 454 1.4<br />
35 Dubbo (NSW) 36,340 36,653 313 0.9<br />
36 Lismore (NSW) 31,866 31,926 60 0.2<br />
Source: Australian Bureau <strong>of</strong> Statistics, Regional Population Growth, Australia 2007-08 (catalogue number 3218.0) r - revised p - preliminary<br />
* Statistical Districts consist <strong>of</strong> selected, significant, predominantly urban areas within Australia, which are not located within a Capital <strong>City</strong> Statistical Division.<br />
/24