economic indicators - City of Greater Geelong
economic indicators - City of Greater Geelong
economic indicators - City of Greater Geelong

Create successful ePaper yourself
Turn your PDF publications into a flip-book with our unique Google optimized e-Paper software.
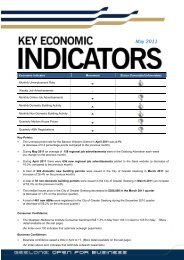
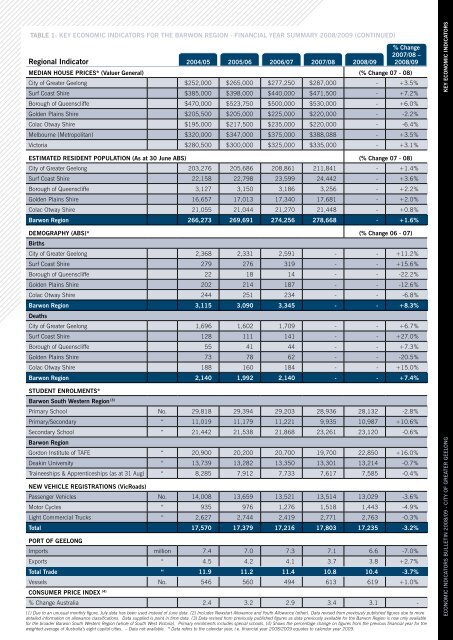
TABLE 1: Key Economic Indicators for the Barwon Region - Financial Year Summary 2008/2009 (continued)<br />
Regional Indicator 2004/05 2005/06 2006/07 2007/08 2008/09<br />
% Change<br />
2007/08 –<br />
2008/09<br />
MEDIAN HOUSE PRICES* (Valuer General) (% Change 07 - 08)<br />
<strong>City</strong> <strong>of</strong> <strong>Greater</strong> <strong>Geelong</strong> $252,000 $265,000 $277,250 $287,000 - +3.5%<br />
Surf Coast Shire $385,000 $398,000 $440,000 $471,500 - +7.2%<br />
Borough <strong>of</strong> Queenscliffe $470,000 $523,750 $500,000 $530,000 - +6.0%<br />
Golden Plains Shire $205,500 $205,000 $225,000 $220,000 - -2.2%<br />
Colac Otway Shire $195,000 $217,500 $235,000 $220,000 - -6.4%<br />
Melbourne (Metropolitan) $320,000 $347,000 $375,000 $388,088 - +3.5%<br />
Victoria $280,500 $300,000 $325,000 $335,000 - +3.1%<br />
ESTIMATED RESIDENT POPULATION (As at 30 June ABS) (% Change 07 - 08)<br />
<strong>City</strong> <strong>of</strong> <strong>Greater</strong> <strong>Geelong</strong> 203,276 205,686 208,861 211,841 - +1.4%<br />
Surf Coast Shire 22,158 22,798 23,599 24,442 - +3.6%<br />
Borough <strong>of</strong> Queenscliffe 3,127 3,150 3,186 3,256 - +2.2%<br />
Golden Plains Shire 16,657 17,013 17,340 17,681 - +2.0%<br />
Colac Otway Shire 21,055 21,044 21,270 21,448 - +0.8%<br />
Barwon Region 266,273 269,691 274,256 278,668 - +1.6%<br />
DEMOGRAPHY (ABS)* (% Change 06 - 07)<br />
Births<br />
<strong>City</strong> <strong>of</strong> <strong>Greater</strong> <strong>Geelong</strong> 2,368 2,331 2,591 - - +11.2%<br />
Surf Coast Shire 279 276 319 - - +15.6%<br />
Borough <strong>of</strong> Queenscliffe 22 18 14 - - -22.2%<br />
Golden Plains Shire 202 214 187 - - -12.6%<br />
Colac Otway Shire 244 251 234 - - -6.8%<br />
Barwon Region 3,115 3,090 3,345 - - +8.3%<br />
Deaths<br />
<strong>City</strong> <strong>of</strong> <strong>Greater</strong> <strong>Geelong</strong> 1,696 1,602 1,709 - - +6.7%<br />
Surf Coast Shire 128 111 141 - - +27.0%<br />
Borough <strong>of</strong> Queenscliffe 55 41 44 - - +7.3%<br />
Golden Plains Shire 73 78 62 - - -20.5%<br />
Colac Otway Shire 188 160 184 - - +15.0%<br />
Barwon Region 2,140 1,992 2,140 - - +7.4%<br />
STUDENT ENROLMENTS*<br />
Barwon South Western Region (3)<br />
Primary School No. 29,818 29,394 29,203 28,936 28,132 -2.8%<br />
Primary/Secondary “ 11,019 11,179 11,221 9,935 10,987 +10.6%<br />
Secondary School “ 21,442 21,538 21,868 23,261 23,120 -0.6%<br />
Barwon Region<br />
Gordon Institute <strong>of</strong> TAFE “ 20,900 20,200 20,700 19,700 22,850 +16.0%<br />
Deakin University “ 13,739 13,282 13,350 13,301 13,214 -0.7%<br />
Traineeships & Apprenticeships (as at 31 Aug) “ 8,285 7,912 7,733 7,617 7,585 -0.4%<br />
NEW VEHICLE REGISTRATIONS (VicRoads)<br />
Passenger Vehicles No. 14,008 13,659 13,521 13,514 13,029 -3.6%<br />
Motor Cycles “ 935 976 1,276 1,518 1,443 -4.9%<br />
Light Commercial Trucks “ 2,627 2,744 2,419 2,771 2,763 -0.3%<br />
Total 17,570 17,379 17,216 17,803 17,235 -3.2%<br />
PORT OF GEELONG<br />
Imports million 7.4 7.0 7.3 7.1 6.6 -7.0%<br />
Exports “ 4.5 4.2 4.1 3.7 3.8 +2.7%<br />
Total Trade “ 11.9 11.2 11.4 10.8 10.4 -3.7%<br />
Vessels No. 546 560 494 613 619 +1.0%<br />
Consumer Price Index (4)<br />
% Change Australia 2.4 3.2 2.9 3.4 3.1 -<br />
(1) Due to an unusual monthly figure, July data has been used instead <strong>of</strong> June data. (2) Includes Newstart Allowance and Youth Allowance (other). Data revised from previously published figures due to more<br />
detailed information on allowance classifications. Data supplied is point in time data. (3) Data revised from previously published figures as data previously available for the Barwon Region is now only available<br />
for the broader Barwon South Western Region (whole <strong>of</strong> South West Victoria). Primary enrolments includes special schools. (4) Shows the percentage change on figures from the previous financial year for the<br />
weighted average <strong>of</strong> Australia’s eight capital cities. – Data not available. * Data refers to the calendar year, i.e. financial year 2008/2009 equates to calendar year 2009.<br />
<strong>economic</strong> <strong>indicators</strong> bulletin 2008/09 - CITY OF GREATER GEELONG key <strong>economic</strong> <strong>indicators</strong>