economic indicators - City of Greater Geelong
economic indicators - City of Greater Geelong
economic indicators - City of Greater Geelong

You also want an ePaper? Increase the reach of your titles
YUMPU automatically turns print PDFs into web optimized ePapers that Google loves.
population growth<br />
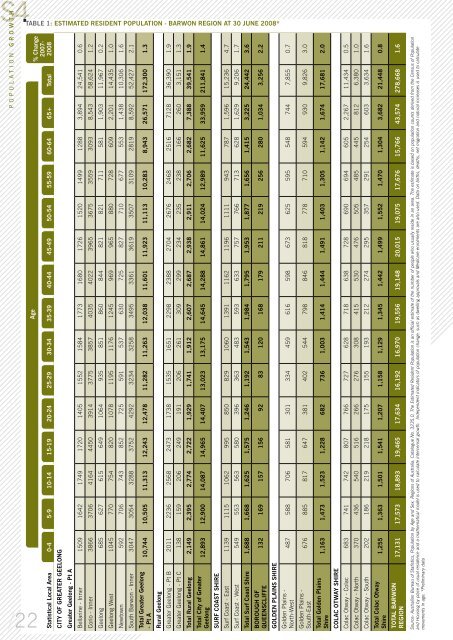
S4TABLE 1: Estimated Resident Population - Barwon Region at 30 June 2008*<br />
% Change<br />
2007-<br />
2008<br />
Age<br />
/22<br />
Statistical Local Area 0-4 5-9 10-14 15-19 20-24 25-29 30-34 35-39 40-44 45-49 50-54 55-59 60-64 65+ Total<br />
CITY OF GREATER GEELONG<br />
<strong>Greater</strong> <strong>Geelong</strong> - Pt A<br />
Bellarine - Inner 1509 1642 1749 1720 1405 1552 1584 1773 1680 1726 1520 1499 1288 3,894 24,541 0.6<br />
Corio - Inner 3866 3706 4164 4450 3914 3775 3857 4035 4022 3965 3675 3559 3093 8,543 58,624 1.2<br />
<strong>Geelong</strong> 685 627 615 649 1064 935 851 860 844 821 821 711 581 1,903 11,967 0.2<br />
<strong>Geelong</strong> West 1045 770 754 820 1078 1195 1176 1245 969 965 880 728 609 2,201 14,435 1.0<br />
Newtown 592 706 743 852 725 591 537 630 725 827 710 677 553 1,438 10,306 1.6<br />
South Barwon - Inner 3047 3054 3288 3752 4292 3234 3258 3495 3361 3619 3507 3109 2819 8,592 52,427 2.1<br />
10,744 10,505 11,313 12,243 12,478 11,282 11,263 12,038 11,601 11,923 11,113 10,283 8,943 26,571 172,300 1.3<br />
Total <strong>Greater</strong> <strong>Geelong</strong><br />
- Pt A<br />
Rural <strong>Geelong</strong><br />
<strong>Greater</strong> <strong>Geelong</strong> - Pt B 2011 2236 2568 2473 1738 1535 1651 2298 2388 2704 2676 2468 2516 7128 36,390 1.9<br />
<strong>Greater</strong> <strong>Geelong</strong> - Pt C 138 159 206 249 191 206 261 309 299 234 235 238 166 260 3,151 1.3<br />
Total Rural <strong>Geelong</strong> 2,149 2,395 2,774 2,722 1,929 1,741 1,912 2,607 2,687 2,938 2,911 2,706 2,682 7,388 39,541 1.9<br />
12,893 12,900 14,087 14,965 14,407 13,023 13,175 14,645 14,288 14,861 14,024 12,989 11,625 33,959 211,841 1.4<br />
Total <strong>City</strong> <strong>of</strong> <strong>Greater</strong><br />
<strong>Geelong</strong><br />
SURF COAST SHIRE<br />
Surf Coast - East 1139 1115 1062 995 850 829 1060 1391 1162 1196 1111 943 787 1,596 15,236 4.7<br />
Surf Coast - West 549 553 563 580 396 363 483 593 633 757 766 713 628 1,629 9,206 1.7<br />
Total Surf Coast Shire 1,688 1,668 1,625 1,575 1,246 1,192 1,543 1,984 1,795 1,953 1,877 1,656 1,415 3,225 24,442 3.6<br />
132 169 157 156 92 83 120 168 179 211 219 256 280 1,034 3,256 2.2<br />
BOROUGH OF<br />
QUEENSCLIFFE<br />
GOLDEN PLAINS SHIRE<br />
487 588 706 581 301 334 459 616 598 673 625 595 548 744 7,855 0.7<br />
Golden Plains -<br />
North-West<br />
676 885 817 647 381 402 544 798 846 818 778 710 594 930 9,826 3.0<br />
Golden Plains -<br />
South-East<br />
1,163 1,473 1,523 1,228 682 736 1,003 1,414 1,444 1,491 1,403 1,305 1,142 1,674 17,681 2.0<br />
Total Golden Plains<br />
Shire<br />
COLAC OTWAY SHIRE<br />
Colac Otway - Colac 683 741 742 807 766 727 628 718 638 728 690 694 605 2,267 11,434 0.5<br />
Colac Otway - North 370 436 540 516 266 276 308 415 530 476 505 485 445 812 6,380 1.0<br />
Colac Otway - South 202 186 219 218 175 155 193 212 274 295 357 291 254 603 3,634 1.6<br />
1,255 1,363 1,501 1,541 1,207 1,158 1,129 1,345 1,442 1,499 1,552 1,470 1,304 3,682 21,448 0.8<br />
Total Colac Otway<br />
Shire<br />
17,131 17,573 18,893 19,465 17,634 16,192 16,970 19,556 19,148 20,015 19,075 17,676 15,766 43,574 278,668 1.6<br />
TOTAL BARWON<br />
REGION<br />
Source: Australian Bureau <strong>of</strong> Statistics, Population by Age and Sex, Regions <strong>of</strong> Australia, Catalogue No. 3235.0. The Estimated Resident Population is an <strong>of</strong>ficial estimate <strong>of</strong> the number <strong>of</strong> people who usually reside in an area. The estimate is based on population counts derived from the Census <strong>of</strong> Population<br />
and Housing by place <strong>of</strong> usual residence and a mathematical model is used to calculate intercensal growth. Independent <strong>indicators</strong> <strong>of</strong> population change, such as dwelling approvals and Medicare enrolments are also used. Data on births, deaths, net migration and natural increases is used to calculate<br />
movements in age. *Preliminary data