chapter 3 - RiuNet
chapter 3 - RiuNet
chapter 3 - RiuNet

You also want an ePaper? Increase the reach of your titles
YUMPU automatically turns print PDFs into web optimized ePapers that Google loves.
CHAPTER 4<br />
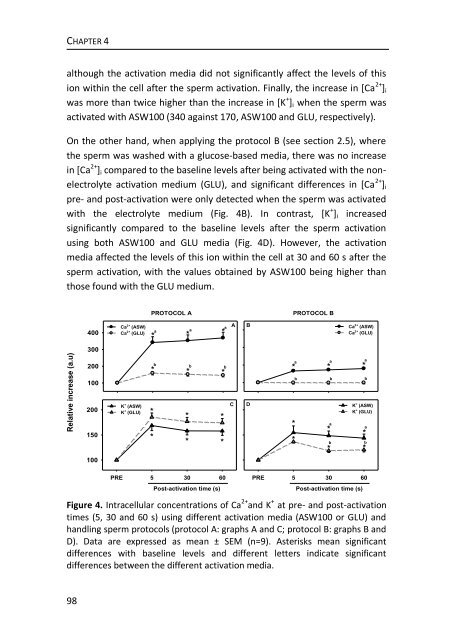
although the activation media did not significantly affect the levels of this<br />
ion within the cell after the sperm activation. Finally, the increase in [Ca 2+ ] i<br />
was more than twice higher than the increase in [K + ] i when the sperm was<br />
activated with ASW100 (340 against 170, ASW100 and GLU, respectively).<br />
On the other hand, when applying the protocol B (see section 2.5), where<br />
the sperm was washed with a glucose-based media, there was no increase<br />
in [Ca 2+ ] i compared to the baseline levels after being activated with the nonelectrolyte<br />
activation medium (GLU), and significant differences in [Ca 2+ ] i<br />
pre- and post-activation were only detected when the sperm was activated<br />
with the electrolyte medium (Fig. 4B). In contrast, [K + ] i increased<br />
significantly compared to the baseline levels after the sperm activation<br />
using both ASW100 and GLU media (Fig. 4D). However, the activation<br />
media affected the levels of this ion within the cell at 30 and 60 s after the<br />
sperm activation, with the values obtained by ASW100 being higher than<br />
those found with the GLU medium.<br />
PROTOCOL A<br />
PROTOCOL B<br />
400<br />
Ca 2+ (ASW)<br />
Ca 2+ (GLU)<br />
a<br />
* *<br />
a<br />
*<br />
a<br />
A<br />
B<br />
Ca 2+ (ASW)<br />
Ca 2+ (GLU)<br />
300<br />
Relative increase (a.u)<br />
200<br />
100<br />
200<br />
150<br />
K + (ASW)<br />
K + (GLU)<br />
*<br />
*<br />
*<br />
b b b<br />
* *<br />
* *<br />
* *<br />
C<br />
D<br />
* * *<br />
*<br />
*<br />
a a a<br />
b b b<br />
a<br />
*<br />
b<br />
K + (ASW)<br />
K + (GLU)<br />
*<br />
* *<br />
a<br />
b<br />
100<br />
PRE 5 30 60<br />
Post-activation time (s)<br />
PRE 5 30 60<br />
Post-activation time (s)<br />
Figure 4. Intracellular concentrations of Ca 2+ and K + at pre- and post-activation<br />
times (5, 30 and 60 s) using different activation media (ASW100 or GLU) and<br />
handling sperm protocols (protocol A: graphs A and C; protocol B: graphs B and<br />
D). Data are expressed as mean ± SEM (n=9). Asterisks mean significant<br />
differences with baseline levels and different letters indicate significant<br />
differences between the different activation media.<br />
98