chapter 3 - RiuNet
chapter 3 - RiuNet
chapter 3 - RiuNet

Create successful ePaper yourself
Turn your PDF publications into a flip-book with our unique Google optimized e-Paper software.
EFFECT OF THERMAL REGIMES AND HORMONAL TREATMENTS<br />
The highest density values were observed in T20 males, with significant<br />
differences in most of the weeks (Fig. 2C). Similar density patterns were<br />
observed in T20 and T15 males, while T10 males showed an increase in<br />
their first 3 weeks of spermiation (10 th to 12 th week) followed by a marked<br />
decrease in the last week of the experiment (13th week). Regarding total<br />
and progressive motility (Fig. 2D and E), T20 treatment demonstrated the<br />
highest values, reaching maximum values of 75 and 35%, respectively at<br />
week 11. From this week to the end of treatment, T20 males displayed a<br />
marked decrease in total and progressive motility. Males subjected to the<br />
T10 thermal regime showed a significant but delayed increase in motility<br />
parameters from its first spermiation week (week 10) to the end of the<br />
experiment, and ended up exceeding the values obtained with the T15 and<br />
T20 treatments due to the fact that this coincided with the final reduction<br />
of motility in these treatments in the last week of treatment.<br />
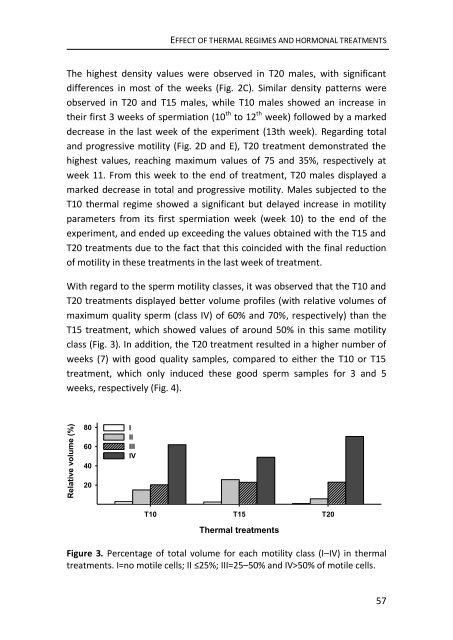
With regard to the sperm motility classes, it was observed that the T10 and<br />
T20 treatments displayed better volume profiles (with relative volumes of<br />
maximum quality sperm (class IV) of 60% and 70%, respectively) than the<br />
T15 treatment, which showed values of around 50% in this same motility<br />
class (Fig. 3). In addition, the T20 treatment resulted in a higher number of<br />
weeks (7) with good quality samples, compared to either the T10 or T15<br />
treatment, which only induced these good sperm samples for 3 and 5<br />
weeks, respectively (Fig. 4).<br />
Relative volume (%)<br />
80 I<br />
II<br />
60<br />
III<br />
IV<br />
40<br />
20<br />
T10 T15 T20<br />
Thermal treatments<br />
Figure 3. Percentage of total volume for each motility class (I–IV) in thermal<br />
treatments. I=no motile cells; II ≤25%; III=25–50% and IV>50% of motile cells.<br />
57