

Boundary-layer height detection with a ceilometer at a coastal ... - Orbit
Boundary-layer height detection with a ceilometer at a coastal ... - Orbit
Boundary-layer height detection with a ceilometer at a coastal ... - Orbit

Create successful ePaper yourself
Turn your PDF publications into a flip-book with our unique Google optimized e-Paper software.
All d<strong>at</strong>a 01 May 2010<br />
1000 N = 133<br />
1000 N = 133<br />
BLH [m] minimum TKE<br />
800<br />
600<br />
400<br />
200<br />
R = 0.86<br />
Slope = 0.98<br />
RMSD = 118<br />
BLH [m] minimum TKE<br />
800<br />
600<br />
400<br />
200<br />
R = 0.86<br />
Slope = 0.97<br />
RMSD = 119<br />
0<br />
0 500 1000<br />
BLH [m] ideal. profile<br />
0<br />
0 500 1000<br />
BLH [m] exp. ideal. profile<br />
1000 N = 133<br />
1000 N = 133<br />
BLH [m] minimum TKE<br />
800<br />
600<br />
400<br />
200<br />
R = 0.86<br />
Slope = 0.97<br />
RMSD = 118<br />
BLH [m] minimum TKE<br />
800<br />
600<br />
400<br />
200<br />
R = 0.87<br />
Slope = 0.97<br />
RMSD = 117<br />
0<br />
0 500 1000<br />
BLH [m] vertical gradient<br />
0<br />
0 500 1000<br />
BLH [m] critical threshold<br />
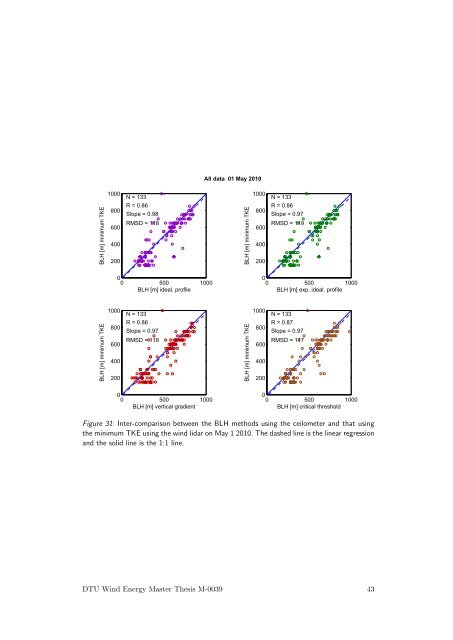
Figure 31: Inter-comparison between the BLH methods using the <strong>ceilometer</strong> and th<strong>at</strong> using<br />
the minimum TKE using the wind lidar on May 1 2010. The dashed line is the linear regression<br />
and the solid line is the 1:1 line.<br />
DTU Wind Energy Master Thesis M-0039 43


