

Boundary-layer height detection with a ceilometer at a coastal ... - Orbit
Boundary-layer height detection with a ceilometer at a coastal ... - Orbit
Boundary-layer height detection with a ceilometer at a coastal ... - Orbit

You also want an ePaper? Increase the reach of your titles
YUMPU automatically turns print PDFs into web optimized ePapers that Google loves.
Threshold<br />
Westerly winds<br />
Ideal profile<br />
120<br />
100<br />
NW<br />
SW<br />
120<br />
100<br />
NW<br />
SW<br />
counts<br />
80<br />
60<br />
counts<br />
80<br />
60<br />
40<br />
40<br />
20<br />
20<br />
0<br />
0 500 1000 1500 2000<br />
BLH<br />
0<br />
0 500 1000 1500 2000<br />
BLH<br />
Exponent−ideal profile<br />
Vertical gradient<br />
120<br />
100<br />
NW<br />
SW<br />
120<br />
100<br />
NW<br />
SW<br />
counts<br />
80<br />
60<br />
counts<br />
80<br />
60<br />
40<br />
40<br />
20<br />
20<br />
0<br />
0 500 1000 1500 2000<br />
BLH<br />
0<br />
0 500 1000 1500 2000<br />
BLH<br />
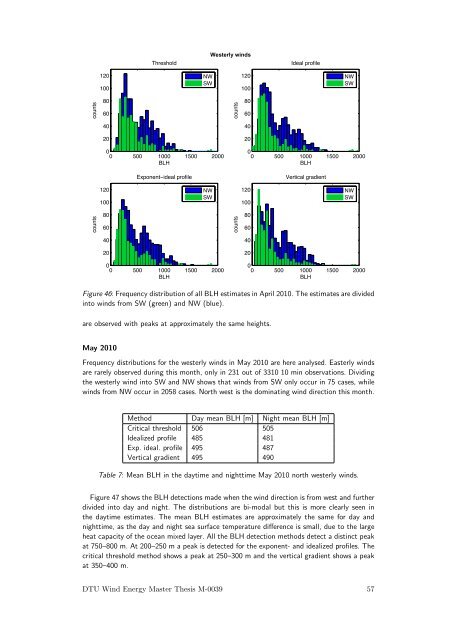
Figure 46: Frequency distribution of all BLH estim<strong>at</strong>es in April 2010. The estim<strong>at</strong>es are divided<br />
into winds from SW (green) and NW (blue).<br />
are observed <strong>with</strong> peaks <strong>at</strong> approxim<strong>at</strong>ely the same <strong>height</strong>s.<br />
May 2010<br />
Frequency distributions for the westerly winds in May 2010 are here analysed. Easterly winds<br />
are rarely observed during this month, only in 231 out of 3310 10 min observ<strong>at</strong>ions. Dividing<br />
the westerly wind into SW and NW shows th<strong>at</strong> winds from SW only occur in 75 cases, while<br />
winds from NW occur in 2058 cases. North west is the domin<strong>at</strong>ing wind direction this month.<br />
Method Day mean BLH [m] Night mean BLH [m]<br />
Critical threshold 506 505<br />
Idealized profile 485 481<br />
Exp. ideal. profile 495 487<br />
Vertical gradient 495 490<br />
Table 7: Mean BLH in the daytime and nighttime May 2010 north westerly winds.<br />
Figure 47 shows the BLH <strong>detection</strong>s made when the wind direction is from west and further<br />
divided into day and night. The distributions are bi-modal but this is more clearly seen in<br />
the daytime estim<strong>at</strong>es. The mean BLH estim<strong>at</strong>es are approxim<strong>at</strong>ely the same for day and<br />
nighttime, as the day and night sea surface temper<strong>at</strong>ure difference is small, due to the large<br />
he<strong>at</strong> capacity of the ocean mixed <strong>layer</strong>. All the BLH <strong>detection</strong> methods detect a distinct peak<br />
<strong>at</strong> 750–800 m. At 200–250 m a peak is detected for the exponent- and idealized profiles. The<br />
critical threshold method shows a peak <strong>at</strong> 250–300 m and the vertical gradient shows a peak<br />
<strong>at</strong> 350–400 m.<br />
DTU Wind Energy Master Thesis M-0039 57


