Cloud Statistics from Calipso Lidar Data for the ... - espace-tum.de
Cloud Statistics from Calipso Lidar Data for the ... - espace-tum.de
Cloud Statistics from Calipso Lidar Data for the ... - espace-tum.de

Create successful ePaper yourself
Turn your PDF publications into a flip-book with our unique Google optimized e-Paper software.
Appendix. Detailed results 76<br />
Logarithmic binning<br />
By <strong>de</strong>finition a bin of constant logarithmic width means that <strong>the</strong> logarithm of <strong>the</strong> upper<br />
edge of a bin (x i+1 ) is equal to <strong>the</strong> logarithm of <strong>the</strong> lower edge of that bin x i plus <strong>the</strong><br />
bin width b w . That is,<br />
log(x i+1 = log(x i ) + b w<br />
Each binned value x b can easily be calculated by <strong>the</strong> average of all x i <strong>for</strong> i=1,..,n such<br />
that i falls in <strong>the</strong> bin.<br />
x b = x 1 + x 2 + . . . + x n<br />
n<br />
Note that n is <strong>the</strong> number of integers that fall into each given bin regardless of whe<strong>the</strong>r<br />
x b is zero or not. Fur<strong>the</strong>rmore, <strong>for</strong> <strong>the</strong> last bin all integers, even if <strong>the</strong>y are beyond <strong>the</strong><br />
last data point, have to be inclu<strong>de</strong>d in n.<br />
Power law fit uncertainty<br />
60°N<br />
30°N<br />
0.30<br />
0.27<br />
0.24<br />
0.21<br />
0°<br />
0.18<br />
0.15<br />
30°S<br />
60°S<br />
0.12<br />
0.09<br />
0.06<br />
180° 135°W 90°W 45°W 0° 45°E 90°E 135°E<br />
180°<br />
60°N<br />
30°N<br />
10<br />
9<br />
8<br />
7<br />
0°<br />
6<br />
5<br />
30°S<br />
60°S<br />
180° 135°W 90°W 45°W 0° 45°E 90°E 135°E<br />
180°<br />
4<br />
3<br />
2<br />
1<br />
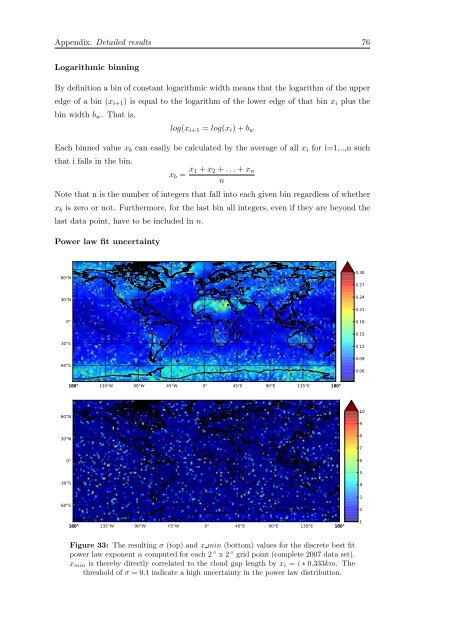
Figure 33: The resulting σ (top) and x min (bottom) values <strong>for</strong> <strong>the</strong> discrete best fit<br />
power law exponent α computed <strong>for</strong> each 2 ◦ x 2 ◦ grid point (complete 2007 data set).<br />
x min is <strong>the</strong>reby directly correlated to <strong>the</strong> cloud gap length by x i = i ∗ 0.333km. The<br />
threshold of σ = 0.1 indicate a high uncertainty in <strong>the</strong> power law distribution.