Cloud Statistics from Calipso Lidar Data for the ... - espace-tum.de
Cloud Statistics from Calipso Lidar Data for the ... - espace-tum.de
Cloud Statistics from Calipso Lidar Data for the ... - espace-tum.de

You also want an ePaper? Increase the reach of your titles
YUMPU automatically turns print PDFs into web optimized ePapers that Google loves.
Chapter 6. <strong>Cloud</strong> flatness occurrence 60<br />
events are located mainly above oceans and especially in front of <strong>the</strong> western coast of<br />
all continents (e.g. West Coast of North America, South America, Europe, Africa and<br />
Australia). The general maritime dominance is related to <strong>the</strong> typically smooth shape of<br />
<strong>the</strong> maritime boundary layer.<br />
(a)<br />
60°N<br />
30°N<br />
0°<br />
30°S<br />
60°S<br />
180° 135°W 90°W 45°W 0° 45°E 90°E 135°E<br />
180°<br />
0 1 2 3 4 5 6 7 8<br />
(b)<br />
(c)<br />
Height [km]<br />
8<br />
7<br />
6<br />
5<br />
4<br />
3<br />
2<br />
1<br />
0<br />
0 1000 2000 3000 4000 5000<br />
Number of events<br />
Height [km]<br />
8<br />
7<br />
6<br />
5<br />
4<br />
3<br />
2<br />
1<br />
0<br />
-82 -60 -30 0 30 60 82<br />
Latitu<strong>de</strong><br />
80<br />
72<br />
64<br />
56<br />
48<br />
40<br />
32<br />
24<br />
16<br />
8<br />
0<br />
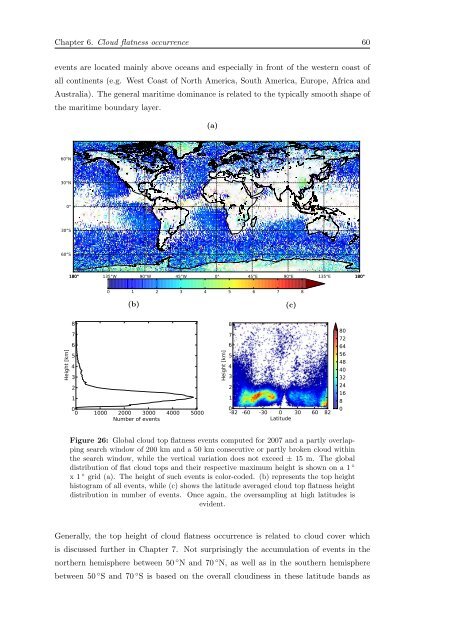
Figure 26: Global cloud top flatness events computed <strong>for</strong> 2007 and a partly overlapping<br />
search window of 200 km and a 50 km consecutive or partly broken cloud within<br />
<strong>the</strong> search window, while <strong>the</strong> vertical variation does not exceed ± 15 m. The global<br />
distribution of flat cloud tops and <strong>the</strong>ir respective maximum height is shown on a 1 ◦<br />
x 1 ◦ grid (a). The height of such events is color-co<strong>de</strong>d. (b) represents <strong>the</strong> top height<br />
histogram of all events, while (c) shows <strong>the</strong> latitu<strong>de</strong> averaged cloud top flatness height<br />
distribution in number of events. Once again, <strong>the</strong> oversampling at high latitu<strong>de</strong>s is<br />
evi<strong>de</strong>nt.<br />
Generally, <strong>the</strong> top height of cloud flatness occurrence is related to cloud cover which<br />
is discussed fur<strong>the</strong>r in Chapter 7. Not surprisingly <strong>the</strong> accumulation of events in <strong>the</strong><br />
nor<strong>the</strong>rn hemisphere between 50 ◦ N and 70 ◦ N, as well as in <strong>the</strong> sou<strong>the</strong>rn hemisphere<br />
between 50 ◦ S and 70 ◦ S is based on <strong>the</strong> overall cloudiness in <strong>the</strong>se latitu<strong>de</strong> bands as