Cloud Statistics from Calipso Lidar Data for the ... - espace-tum.de
Cloud Statistics from Calipso Lidar Data for the ... - espace-tum.de
Cloud Statistics from Calipso Lidar Data for the ... - espace-tum.de

You also want an ePaper? Increase the reach of your titles
YUMPU automatically turns print PDFs into web optimized ePapers that Google loves.
Chapter 7. <strong>Cloud</strong> top height distribution 66<br />
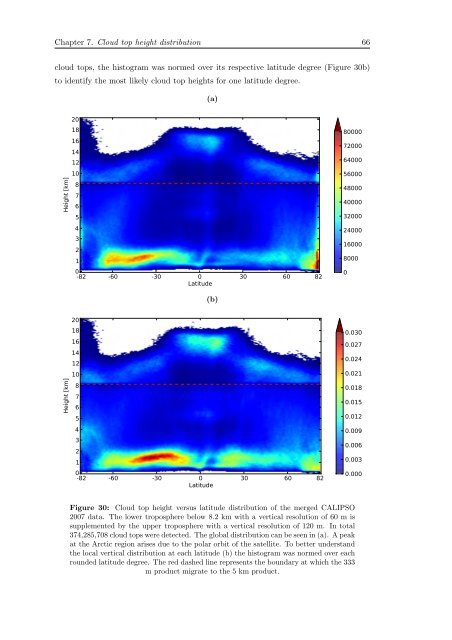
cloud tops, <strong>the</strong> histogram was normed over its respective latitu<strong>de</strong> <strong>de</strong>gree (Figure 30b)<br />
to i<strong>de</strong>ntify <strong>the</strong> most likely cloud top heights <strong>for</strong> one latitu<strong>de</strong> <strong>de</strong>gree.<br />
(a)<br />
Height [km]<br />
20<br />
18<br />
16<br />
14<br />
12<br />
10<br />
8<br />
7<br />
6<br />
5<br />
4<br />
3<br />
2<br />
1<br />
0<br />
-82 -60 -30 0 30 60 82<br />
Latitu<strong>de</strong><br />
80000<br />
72000<br />
64000<br />
56000<br />
48000<br />
40000<br />
32000<br />
24000<br />
16000<br />
8000<br />
0<br />
(b)<br />
Height [km]<br />
20<br />
18<br />
16<br />
14<br />
12<br />
10<br />
8<br />
7<br />
6<br />
5<br />
4<br />
3<br />
2<br />
1<br />
0<br />
-82 -60 -30 0 30 60 82<br />
Latitu<strong>de</strong><br />
0.030<br />
0.027<br />
0.024<br />
0.021<br />
0.018<br />
0.015<br />
0.012<br />
0.009<br />
0.006<br />
0.003<br />
0.000<br />
Figure 30: <strong>Cloud</strong> top height versus latitu<strong>de</strong> distribution of <strong>the</strong> merged CALIPSO<br />
2007 data. The lower troposphere below 8.2 km with a vertical resolution of 60 m is<br />
supplemented by <strong>the</strong> upper troposphere with a vertical resolution of 120 m. In total<br />
374,285,708 cloud tops were <strong>de</strong>tected. The global distribution can be seen in (a). A peak<br />
at <strong>the</strong> Arctic region arises due to <strong>the</strong> polar orbit of <strong>the</strong> satellite. To better un<strong>de</strong>rstand<br />
<strong>the</strong> local vertical distribution at each latitu<strong>de</strong> (b) <strong>the</strong> histogram was normed over each<br />
roun<strong>de</strong>d latitu<strong>de</strong> <strong>de</strong>gree. The red dashed line represents <strong>the</strong> boundary at which <strong>the</strong> 333<br />
m product migrate to <strong>the</strong> 5 km product.