Cloud Statistics from Calipso Lidar Data for the ... - espace-tum.de
Cloud Statistics from Calipso Lidar Data for the ... - espace-tum.de
Cloud Statistics from Calipso Lidar Data for the ... - espace-tum.de

You also want an ePaper? Increase the reach of your titles
YUMPU automatically turns print PDFs into web optimized ePapers that Google loves.
Chapter 5. <strong>Cloud</strong> free statistics 44<br />
Using only <strong>the</strong> 5 km cloud layer product would flip this effect and <strong>the</strong> CALIPSO data<br />
set would be more cloudy with a cloud free fraction of only 24.8 % [Wu et al., 2011]<br />
compared to <strong>the</strong> MODIS data set. This significant difference compared to <strong>the</strong> merged<br />
CALIPSO data set is caused by <strong>the</strong> averaging algorithm of <strong>the</strong> 5 km product and <strong>the</strong><br />
absence of cloud gaps being smaller than 5 km. A monthly overview of <strong>the</strong> cloud<br />
free fraction <strong>for</strong> <strong>the</strong> CALIPSO merged data set was per<strong>for</strong>med in <strong>the</strong> Appendix (see<br />
Table 13). Although certain variations have to be noticed, <strong>the</strong> general trend and <strong>the</strong><br />
major large-scale patterns are congruent.<br />
(a)<br />
<strong>Cloud</strong> free fraction<br />
0.8<br />
0.7<br />
0.6<br />
0.5<br />
0.4<br />
0.3<br />
0.2<br />
0.1<br />
0.0<br />
82 60 30 0 30 60 82<br />
Latitu<strong>de</strong><br />
(b)<br />
Jan<br />
Feb<br />
0.64<br />
Mar<br />
0.56<br />
Apr<br />
May<br />
0.48<br />
Jun<br />
0.40<br />
Jul<br />
Aug<br />
0.32<br />
Sep<br />
0.24<br />
Oct<br />
Nov<br />
0.16<br />
Dec 0.08<br />
-82 -60 -30 0 30 60 82<br />
Latitu<strong>de</strong><br />
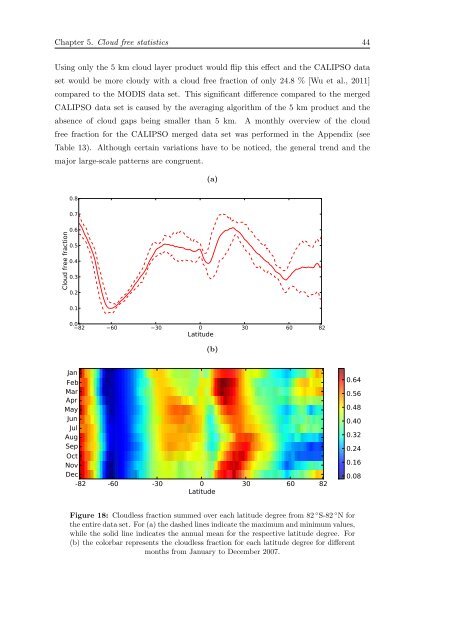
Figure 18: <strong>Cloud</strong>less fraction summed over each latitu<strong>de</strong> <strong>de</strong>gree <strong>from</strong> 82 ◦ S-82 ◦ N <strong>for</strong><br />
<strong>the</strong> entire data set. For (a) <strong>the</strong> dashed lines indicate <strong>the</strong> maximum and minimum values,<br />
while <strong>the</strong> solid line indicates <strong>the</strong> annual mean <strong>for</strong> <strong>the</strong> respective latitu<strong>de</strong> <strong>de</strong>gree. For<br />
(b) <strong>the</strong> colorbar represents <strong>the</strong> cloudless fraction <strong>for</strong> each latitu<strong>de</strong> <strong>de</strong>gree <strong>for</strong> different<br />
months <strong>from</strong> January to December 2007.