Cloud Statistics from Calipso Lidar Data for the ... - espace-tum.de
Cloud Statistics from Calipso Lidar Data for the ... - espace-tum.de
Cloud Statistics from Calipso Lidar Data for the ... - espace-tum.de

You also want an ePaper? Increase the reach of your titles
YUMPU automatically turns print PDFs into web optimized ePapers that Google loves.
Chapter 6. <strong>Cloud</strong> flatness occurrence 58<br />
100 km flat cloud top<br />
exceeding search window<br />
20 km flat cloud top<br />
isolated cloud<br />
40 km flat cloud top<br />
partly flat cloud<br />
HEIGHT<br />
1.42 km<br />
1.39 km<br />
1.36 km<br />
1.33 km<br />
1.30 km<br />
1.27 km<br />
1.24 km<br />
100 km overlap of search window search window with 200 km horizontal extent 100 km overlap of search window<br />
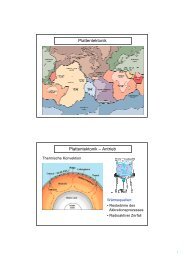
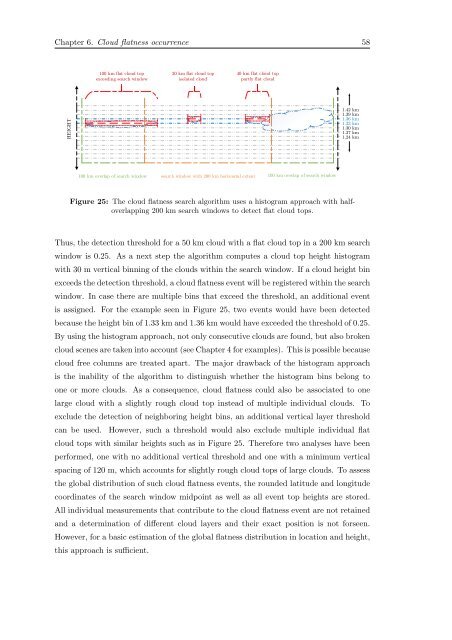
Figure 25: The cloud flatness search algorithm uses a histogram approach with halfoverlapping<br />
200 km search windows to <strong>de</strong>tect flat cloud tops.<br />
Thus, <strong>the</strong> <strong>de</strong>tection threshold <strong>for</strong> a 50 km cloud with a flat cloud top in a 200 km search<br />
window is 0.25. As a next step <strong>the</strong> algorithm computes a cloud top height histogram<br />
with 30 m vertical binning of <strong>the</strong> clouds within <strong>the</strong> search window. If a cloud height bin<br />
exceeds <strong>the</strong> <strong>de</strong>tection threshold, a cloud flatness event will be registered within <strong>the</strong> search<br />
window. In case <strong>the</strong>re are multiple bins that exceed <strong>the</strong> threshold, an additional event<br />
is assigned. For <strong>the</strong> example seen in Figure 25, two events would have been <strong>de</strong>tected<br />
because <strong>the</strong> height bin of 1.33 km and 1.36 km would have excee<strong>de</strong>d <strong>the</strong> threshold of 0.25.<br />
By using <strong>the</strong> histogram approach, not only consecutive clouds are found, but also broken<br />
cloud scenes are taken into account (see Chapter 4 <strong>for</strong> examples). This is possible because<br />
cloud free columns are treated apart. The major drawback of <strong>the</strong> histogram approach<br />
is <strong>the</strong> inability of <strong>the</strong> algorithm to distinguish whe<strong>the</strong>r <strong>the</strong> histogram bins belong to<br />
one or more clouds. As a consequence, cloud flatness could also be associated to one<br />
large cloud with a slightly rough cloud top instead of multiple individual clouds. To<br />
exclu<strong>de</strong> <strong>the</strong> <strong>de</strong>tection of neighboring height bins, an additional vertical layer threshold<br />
can be used. However, such a threshold would also exclu<strong>de</strong> multiple individual flat<br />
cloud tops with similar heights such as in Figure 25. There<strong>for</strong>e two analyses have been<br />
per<strong>for</strong>med, one with no additional vertical threshold and one with a minimum vertical<br />
spacing of 120 m, which accounts <strong>for</strong> slightly rough cloud tops of large clouds. To assess<br />
<strong>the</strong> global distribution of such cloud flatness events, <strong>the</strong> roun<strong>de</strong>d latitu<strong>de</strong> and longitu<strong>de</strong><br />
coordinates of <strong>the</strong> search window midpoint as well as all event top heights are stored.<br />
All individual measurements that contribute to <strong>the</strong> cloud flatness event are not retained<br />
and a <strong>de</strong>termination of different cloud layers and <strong>the</strong>ir exact position is not <strong>for</strong>seen.<br />
However, <strong>for</strong> a basic estimation of <strong>the</strong> global flatness distribution in location and height,<br />
this approach is sufficient.