

skills acTion Plan for The food and Beverage secTor - Department of ...
skills acTion Plan for The food and Beverage secTor - Department of ...
skills acTion Plan for The food and Beverage secTor - Department of ...

Create successful ePaper yourself
Turn your PDF publications into a flip-book with our unique Google optimized e-Paper software.
• Over the five year period (2000-05), excluding<br />
agriculture, the employee count in <strong>food</strong> <strong>and</strong> beverage<br />
has grown by 23% compared to 17% <strong>for</strong> the whole <strong>of</strong><br />
New Zeal<strong>and</strong> over the same period.<br />
• Over the last ten years (1995-2005), total <strong>food</strong> <strong>and</strong><br />
beverage employment by full-time equivalents (FTEs)<br />
increased by 8% (including all agriculture) compared to<br />
total New Zeal<strong>and</strong> FTEs which increased by 22% (SNZ<br />
<strong>and</strong> BERL calculations);<br />
• <strong>The</strong> <strong>food</strong> <strong>and</strong> beverage value chains with the<br />
highest employee count in 2005 were <strong>food</strong> service,<br />
manufacturing <strong>and</strong> retailing, with lower number <strong>of</strong><br />
employees in marine fishing, horticulture <strong>and</strong> <strong>food</strong><br />
wholesaling.<br />
• Between 1995 <strong>and</strong> 2005, the share <strong>of</strong> FTEs in<br />
agricultural production activities declined from 40%<br />
to 33% <strong>of</strong> total <strong>food</strong> <strong>and</strong> beverage employment. <strong>The</strong><br />
<strong>food</strong> service share increased from 16% in 1995 to over<br />
20% in 2005 while the manufacturing share remained<br />
relatively unchanged at about 20% <strong>and</strong> the retailing<br />
activity share at about 15% over the 1995 to 2005<br />
period. <strong>The</strong> wholesaling share rose very slightly from<br />
6% to 8%.<br />
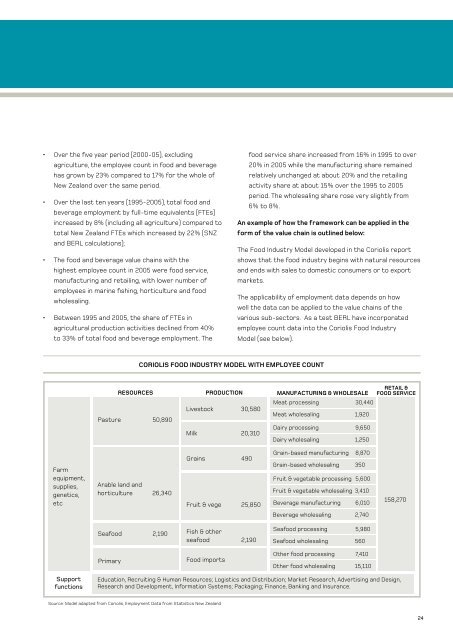
An example <strong>of</strong> how the framework can be applied in the<br />
<strong>for</strong>m <strong>of</strong> the value chain is outlined below:<br />
<strong>The</strong> Food Industry Model developed in the Coriolis report<br />
shows that the <strong>food</strong> industry begins with natural resources<br />
<strong>and</strong> ends with sales to domestic consumers or to export<br />
markets.<br />
<strong>The</strong> applicability <strong>of</strong> employment data depends on how<br />
well the data can be applied to the value chains <strong>of</strong> the<br />
various sub-sectors. As a test BERL have incorporated<br />
employee count data into the Coriolis Food Industry<br />
Model (see below).<br />
CORIOLIS FOOD INDUSTRY MODEL WITH EMPLOYEE COUNT<br />
RESOURCES PRODUCTION MANUFACTURING & WHOLESALE<br />
Meat processing 30,440<br />
Livestock 30,580<br />
Pasture 50,890<br />
Meat wholesaling 1,920<br />
Milk 20,310<br />
Dairy processing 9,650<br />
Dairy wholesaling 1,250<br />
RETAIL &<br />
FOOD SERVICE<br />
Farm<br />
equipment,<br />
supplies,<br />
genetics,<br />
etc<br />
Arable l<strong>and</strong> <strong>and</strong><br />
horticulture 26,340<br />
Grains 490<br />
Fruit & vege 25,850<br />
Grain-based manufacturing 8,870<br />
Grain-based wholesaling 350<br />
Fruit & vegetable processing 5,600<br />
Fruit & vegetable wholesaling 3,410<br />
<strong>Beverage</strong> manufacturing 6,010<br />
158,270<br />
<strong>Beverage</strong> wholesaling 2,740<br />
Sea<strong>food</strong> 2,190<br />
Fish & other<br />
sea<strong>food</strong> 2,190<br />
Sea<strong>food</strong> processing 5,980<br />
Sea<strong>food</strong> wholesaling 560<br />
Primary<br />
Food imports<br />
Other <strong>food</strong> processing 7,410<br />
Other <strong>food</strong> wholesaling 15,110<br />
Support<br />
functions<br />
Education, Recruiting & Human Resources; Logistics <strong>and</strong> Distribution; Market Research, Advertising <strong>and</strong> Design,<br />
Research <strong>and</strong> Development, In<strong>for</strong>mation Systems; Packaging; Finance, Banking <strong>and</strong> Insurance.<br />
Source: Model adapted from Coriolis, Employment Data from Statistics New Zeal<strong>and</strong><br />
24

![a note on levels, trends, and some implications [pdf 21 pages, 139KB]](https://img.yumpu.com/27285836/1/184x260/a-note-on-levels-trends-and-some-implications-pdf-21-pages-139kb.jpg?quality=85)


![Labour Market Trends and Outlook - 1996 [pdf 18 pages, 94KB]](https://img.yumpu.com/27285764/1/184x260/labour-market-trends-and-outlook-1996-pdf-18-pages-94kb.jpg?quality=85)

