Empirical Evaluation of Hybrid Defaultable Bond Pricing ... - risklab
Empirical Evaluation of Hybrid Defaultable Bond Pricing ... - risklab
Empirical Evaluation of Hybrid Defaultable Bond Pricing ... - risklab

Create successful ePaper yourself
Turn your PDF publications into a flip-book with our unique Google optimized e-Paper software.
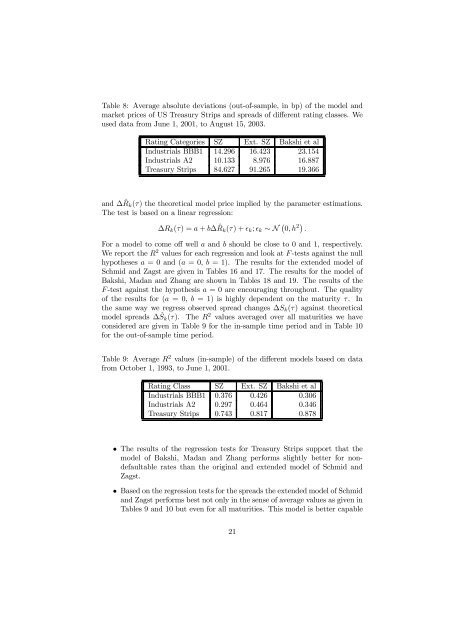
Table 8: Average absolute deviations (out-<strong>of</strong>-sample, in bp) <strong>of</strong> the model and<br />
market prices <strong>of</strong> US Treasury Strips and spreads <strong>of</strong> different rating classes. We<br />
used data from June 1, 2001, to August 15, 2003.<br />
Rating Categories SZ Ext. SZ Bakshi et al<br />
Industrials BBB1 14.296 16.423 23.154<br />
Industrials A2 10.133 8.976 16.887<br />
Treasury Strips 84.627 91.265 19.366<br />
and ∆ ˆR k (τ) the theoretical model price implied by the parameter estimations.<br />
The test is based on a linear regression:<br />
∆R k (τ) =a + b∆ ˆR k (τ)+² k ; ² k ∼ N ¡ 0,h 2¢ .<br />
For a model to come <strong>of</strong>f well a and b should be close to 0 and 1, respectively.<br />
We report the R 2 values for each regression and look at F-tests against the null<br />
hypotheses a =0and (a =0,b= 1). The results for the extended model <strong>of</strong><br />
Schmid and Zagst are given in Tables 16 and 17. The results for the model <strong>of</strong><br />
Bakshi, Madan and Zhang are shown in Tables 18 and 19. The results <strong>of</strong> the<br />
F -test against the hypothesis a =0are encouraging throughout. The quality<br />
<strong>of</strong> the results for (a =0,b= 1) is highly dependent on the maturity τ. In<br />
the same way we regress observed spread changes ∆S k (τ) against theoretical<br />
model spreads ∆Ŝ k (τ). The R 2 values averaged over all maturities we have<br />
considered are given in Table 9 for the in-sample time period and in Table 10<br />
for the out-<strong>of</strong>-sample time period.<br />
Table 9: Average R 2 values (in-sample) <strong>of</strong> the different models based on data<br />
from October 1, 1993, to June 1, 2001.<br />
Rating Class SZ Ext. SZ Bakshi et al<br />
Industrials BBB1 0.376 0.426 0.306<br />
Industrials A2 0.297 0.464 0.346<br />
Treasury Strips 0.743 0.817 0.878<br />
• The results <strong>of</strong> the regression tests for Treasury Strips support that the<br />
model <strong>of</strong> Bakshi, Madan and Zhang performs slightly better for nondefaultable<br />
rates than the original and extended model <strong>of</strong> Schmid and<br />
Zagst.<br />
• Based on the regression tests for the spreads the extended model <strong>of</strong> Schmid<br />
and Zagst performs best not only in the sense <strong>of</strong> average values as given in<br />
Tables 9 and 10 but even for all maturities. This model is better capable<br />
21