Empirical Evaluation of Hybrid Defaultable Bond Pricing ... - risklab
Empirical Evaluation of Hybrid Defaultable Bond Pricing ... - risklab
Empirical Evaluation of Hybrid Defaultable Bond Pricing ... - risklab

You also want an ePaper? Increase the reach of your titles
YUMPU automatically turns print PDFs into web optimized ePapers that Google loves.
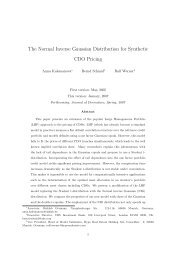
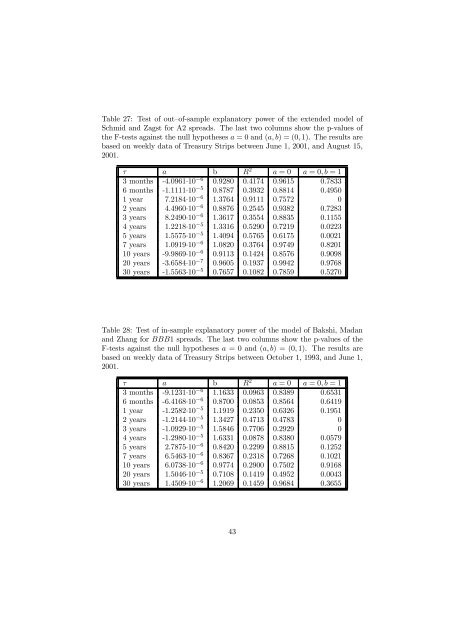
Table 27: Test <strong>of</strong> out—<strong>of</strong>-sample explanatory power <strong>of</strong> the extended model <strong>of</strong><br />
Schmid and Zagst for A2 spreads. The last two columns show the p-values <strong>of</strong><br />
the F-tests against the null hypotheses a =0and (a, b) =(0, 1). The results are<br />
based on weekly data <strong>of</strong> Treasury Strips between June 1, 2001, andAugust15,<br />
2001.<br />
τ a b R 2 a =0 a =0,b= 1<br />
3months -4.0961·10 −6 0.9280 0.4174 0.9615 0.7833<br />
6months -1.1111·10 −5 0.8787 0.3932 0.8814 0.4950<br />
1year 7.2184·10 −6 1.3764 0.9111 0.7572 0<br />
2years 4.4960·10 −6 0.8876 0.2545 0.9382 0.7283<br />
3years 8.2490·10 −6 1.3617 0.3554 0.8835 0.1155<br />
4years 1.2218·10 −5 1.3316 0.5290 0.7219 0.0223<br />
5years 1.5575·10 −5 1.4094 0.5765 0.6175 0.0021<br />
7years 1.0919·10 −6 1.0820 0.3764 0.9749 0.8201<br />
10 years -9.9869·10 −6 0.9113 0.1424 0.8576 0.9098<br />
20 years -3.6584·10 −7 0.9605 0.1937 0.9942 0.9768<br />
30 years -1.5563·10 −5 0.7657 0.1082 0.7859 0.5270<br />
Table 28: Test <strong>of</strong> in-sample explanatory power <strong>of</strong> the model <strong>of</strong> Bakshi, Madan<br />
and Zhang for BBB1 spreads. The last two columns show the p-values <strong>of</strong> the<br />
F-tests against the null hypotheses a =0and (a, b) =(0, 1). The results are<br />
based on weekly data <strong>of</strong> Treasury Strips between October 1, 1993, and June 1,<br />
2001.<br />
τ a b R 2 a =0 a =0,b= 1<br />
3months -9.1231·10 −6 1.1633 0.0963 0.8389 0.6531<br />
6months -6.4168·10 −6 0.8700 0.0853 0.8564 0.6419<br />
1year -1.2582·10 −5 1.1919 0.2350 0.6326 0.1951<br />
2years -1.2144·10 −5 1.3427 0.4713 0.4783 0<br />
3years -1.0929·10 −5 1.5846 0.7706 0.2929 0<br />
4years -1.2980·10 −5 1.6331 0.0878 0.8380 0.0579<br />
5years 2.7875·10 −6 0.8420 0.2299 0.8815 0.1252<br />
7years 6.5463·10 −6 0.8367 0.2318 0.7268 0.1021<br />
10 years 6.0738·10 −6 0.9774 0.2900 0.7502 0.9168<br />
20 years 1.5046·10 −5 0.7108 0.1419 0.4952 0.0043<br />
30 years 1.4509·10 −6 1.2069 0.1459 0.9684 0.3655<br />
43