Empirical Evaluation of Hybrid Defaultable Bond Pricing ... - risklab
Empirical Evaluation of Hybrid Defaultable Bond Pricing ... - risklab
Empirical Evaluation of Hybrid Defaultable Bond Pricing ... - risklab

Create successful ePaper yourself
Turn your PDF publications into a flip-book with our unique Google optimized e-Paper software.
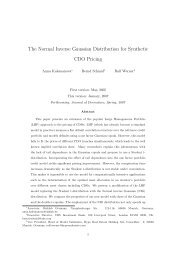
US Industrials BBB1<br />
US Industrials A2<br />
C(0,T)/T*mr %<br />
0.70%<br />
0.60%<br />
0.50%<br />
0.40%<br />
0.30%<br />
0.20%<br />
0.10%<br />
0.00%<br />
0 2 4 6 8 10 12 14 16 18 20 22 24 26 28<br />
Time To Maturity (Years)<br />
Figure 5: Plot <strong>of</strong> the function Cd (t,T )<br />
T −t<br />
from model <strong>of</strong> Schmid and Zagst dependent<br />
on T − t for rating class BBB1 and A2. This function shows how R d (t, T )<br />
depends on s(t). The plot is standardized with the mean reversion levels (mr)<br />
<strong>of</strong> s.<br />
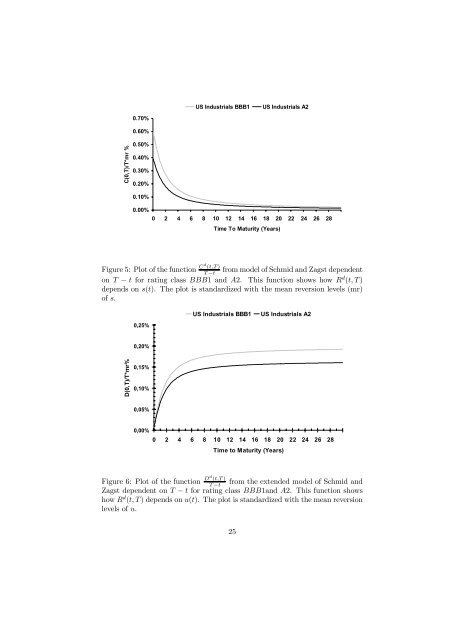
0,25%<br />
US Industrials BBB1<br />
US Industrials A2<br />
0,20%<br />
D(0,T)/T*mr%<br />
0,15%<br />
0,10%<br />
0,05%<br />
0,00%<br />
0 2 4 6 8 10 12 14 16 18 20 22 24 26 28<br />
Time to Maturity (Years)<br />
Figure 6: Plot <strong>of</strong> the function Dd (t,T )<br />
T −t<br />
from the extended model <strong>of</strong> Schmid and<br />
Zagst dependent on T − t for rating class BBB1and A2. This function shows<br />
how R d (t, T ) depends on u(t). The plot is standardized with the mean reversion<br />
levels <strong>of</strong> u.<br />
25