

School of Engineering and Science - Jacobs University
School of Engineering and Science - Jacobs University
School of Engineering and Science - Jacobs University

You also want an ePaper? Increase the reach of your titles
YUMPU automatically turns print PDFs into web optimized ePapers that Google loves.
800<br />
111<br />
Intensity, a.u.<br />
400<br />
200<br />
220 311<br />
0<br />
2Θ<br />
40 60 80<br />
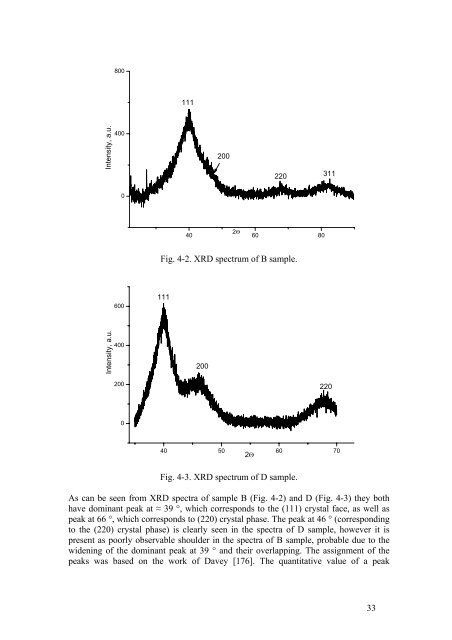
Fig. 4-2. XRD spectrum <strong>of</strong> B sample.<br />
600<br />
111<br />
Intensity, a.u.<br />
400<br />
200<br />
200<br />
220<br />
0<br />
40 50 60 70<br />
2Θ<br />
Fig. 4-3. XRD spectrum <strong>of</strong> D sample.<br />
As can be seen from XRD spectra <strong>of</strong> sample B (Fig. 4-2) <strong>and</strong> D (Fig. 4-3) they both<br />
have dominant peak at ≈ 39 °, which corresponds to the (111) crystal face, as well as<br />
peak at 66 °, which corresponds to (220) crystal phase. The peak at 46 ° (corresponding<br />
to the (220) crystal phase) is clearly seen in the spectra <strong>of</strong> D sample, however it is<br />
present as poorly observable shoulder in the spectra <strong>of</strong> B sample, probable due to the<br />
widening <strong>of</strong> the dominant peak at 39 ° <strong>and</strong> their overlapping. The assignment <strong>of</strong> the<br />
peaks was based on the work <strong>of</strong> Davey [176]. The quantitative value <strong>of</strong> a peak<br />
33


