

School of Engineering and Science - Jacobs University
School of Engineering and Science - Jacobs University
School of Engineering and Science - Jacobs University

Create successful ePaper yourself
Turn your PDF publications into a flip-book with our unique Google optimized e-Paper software.
80<br />
Conversion, %<br />
100<br />
80<br />
60<br />
40<br />
Y =83 - 0.19 X<br />
Hydrogen pressure<br />
10 bar<br />
2 bar<br />
70<br />
60<br />
50<br />
40<br />
Actual enantiomeric excess, %<br />
20<br />
30<br />
0<br />
20<br />
0 50 100 150 200 250 300<br />
Time, min<br />
Y =44 - 0.07 X<br />
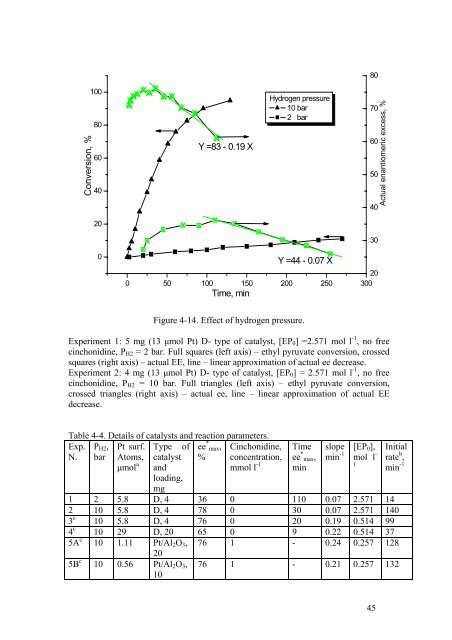
Figure 4-14. Effect <strong>of</strong> hydrogen pressure.<br />
Experiment 1: 5 mg (13 μmol Pt) D- type <strong>of</strong> catalyst, [EP 0 ] =2.571 mol l -1 , no free<br />
cinchonidine, P H2 = 2 bar. Full squares (left axis) – ethyl pyruvate conversion, crossed<br />
squares (right axis) – actual EE, line – linear approximation <strong>of</strong> actual ee decrease.<br />
Experiment 2: 4 mg (13 μmol Pt) D- type <strong>of</strong> catalyst, [EP 0 ] = 2.571 mol l -1 , no free<br />
cinchonidine, P H2 = 10 bar. Full triangles (left axis) – ethyl pyruvate conversion,<br />
crossed triangles (right axis) – actual ee, line – linear approximation <strong>of</strong> actual EE<br />
decrease.<br />
Type <strong>of</strong><br />
[EP ],<br />
Table 4-4. Details <strong>of</strong> catalysts <strong>and</strong> reaction parameters.<br />
Exp. P H2 , Pt surf.<br />
ee * max, Cinchonidine, Time slope Initial<br />
0<br />
N. bar Atoms, catalyst % concentration, ee * max, min -1 mol l - rate b ,<br />
μmol a <strong>and</strong><br />
mmol l -1<br />
1<br />
min<br />
min -1<br />
loading,<br />
mg<br />
1 2 5.8 D, 4 36 0 110 0.07 2.571 14<br />
2 10 5.8 D, 4 78 0 30 0.07 2.571 140<br />
3 c 10 5.8 D, 4 76 0 20 0.19 0.514 99<br />
4 c 10 29 D, 20 65 0 9 0.22 0.514 37<br />
5A c 10 1.11 Pt/Al 2 O 3 , 76 1 - 0.24 0.257 128<br />
20<br />
5B c 10 0.56 Pt/Al 2 O 3 ,<br />
10<br />
76 1 - 0.21 0.257 132<br />
45


